Key findings
As reported by the Financial Times, we apply concepts of money supply to bitcoin to better understand the crypto-economy. This enables us to classify bitcoin users into speculators, services, investors and lost bitcoin. We find that:
- Long term investors sold $30 billion of bitcoin to new speculators between December 2017 and April 2018, with half of this transfer occurring in December alone. This was an unprecedented sell off and such an opportunity is unlikely to be repeated soon.
- The amount of bitcoin held for investment is equal to the amount of bitcoin held for transactions and speculation. This is a significant change since November 2017, when two thirds of available bitcoin were held for investment.
- Bitcoin wealth is concentrated, but this has decreased with the influx of new speculators. Five million bitcoin – one third of available supply – is controlled by the 1,000 largest long term investors and the 600 largest new speculators. Speculators tend to own less bitcoin, with half of speculative coins in wallets containing at least 200 bitcoin, while half of investment coins are held in wallets of at least 700 bitcoin.
- New speculators are likely depressing the price of bitcoin. The supply of bitcoin available for trading has increased by 57% since December 2017. For prices to recover, either speculators will need to reduce supply by HODLing, or demand will need to increase, driven by a new wave of speculators or new bitcoin use cases.
- Between 2.3 and 3.7 million bitcoin are lost, reducing market capitalisation by between 13% and 22%. Market capitalisation could be reduced by a further 35% if illiquid investor holdings are removed from the cap.
- Bitcoin’s money supply is likely to be more liquid than other cryptos. For example, 90% of bitcoin cash, a fork of bitcoin designed to facilitate higher levels of transactions, is held for investment, compared to 50% of bitcoin.
Introduction
Chainalysis clusters[1] the entire bitcoin and bitcoin cash blockchain based on which types of users hold the coins. This allows us to define the money supply according to monetary aggregates. That is to say we can categorise coins from the most liquid, speculative coins and coins used by services for transactions, to less liquid Bitcoin held for investment, including long term HODLers and new investors, to the least liquid, coins that are lost or yet to be mined.
More specifically, we can categorise the money supply into monetary aggregates known as M0, the most liquid category, through to M3, the least liquid. Our mapping of these monetary aggregates to bitcoin is presented in the table below. Technically, monetary aggregates contain the preceding aggregates, so M2 contains the categories M0 and M1 as well as additional, less liquid money. However, in the table below, and throughout, we refer to the M category as just containing the specific type of user described, to avoid confusion.

In the future, an additional category may develop, which would include bitcoin that is held for a period of time as a financial instrument. Examples of bitcoin that would currently be in this category include bitcoin sent to exchanges to be lent to people who wish to trade on margin, or bitcoin held as a hedge until cash-settled bitcoin futures contracts expire[2]. This category would be more liquid than lost and unmined coins, and possibly more liquid than some investment coins.
Bitcoin money supply
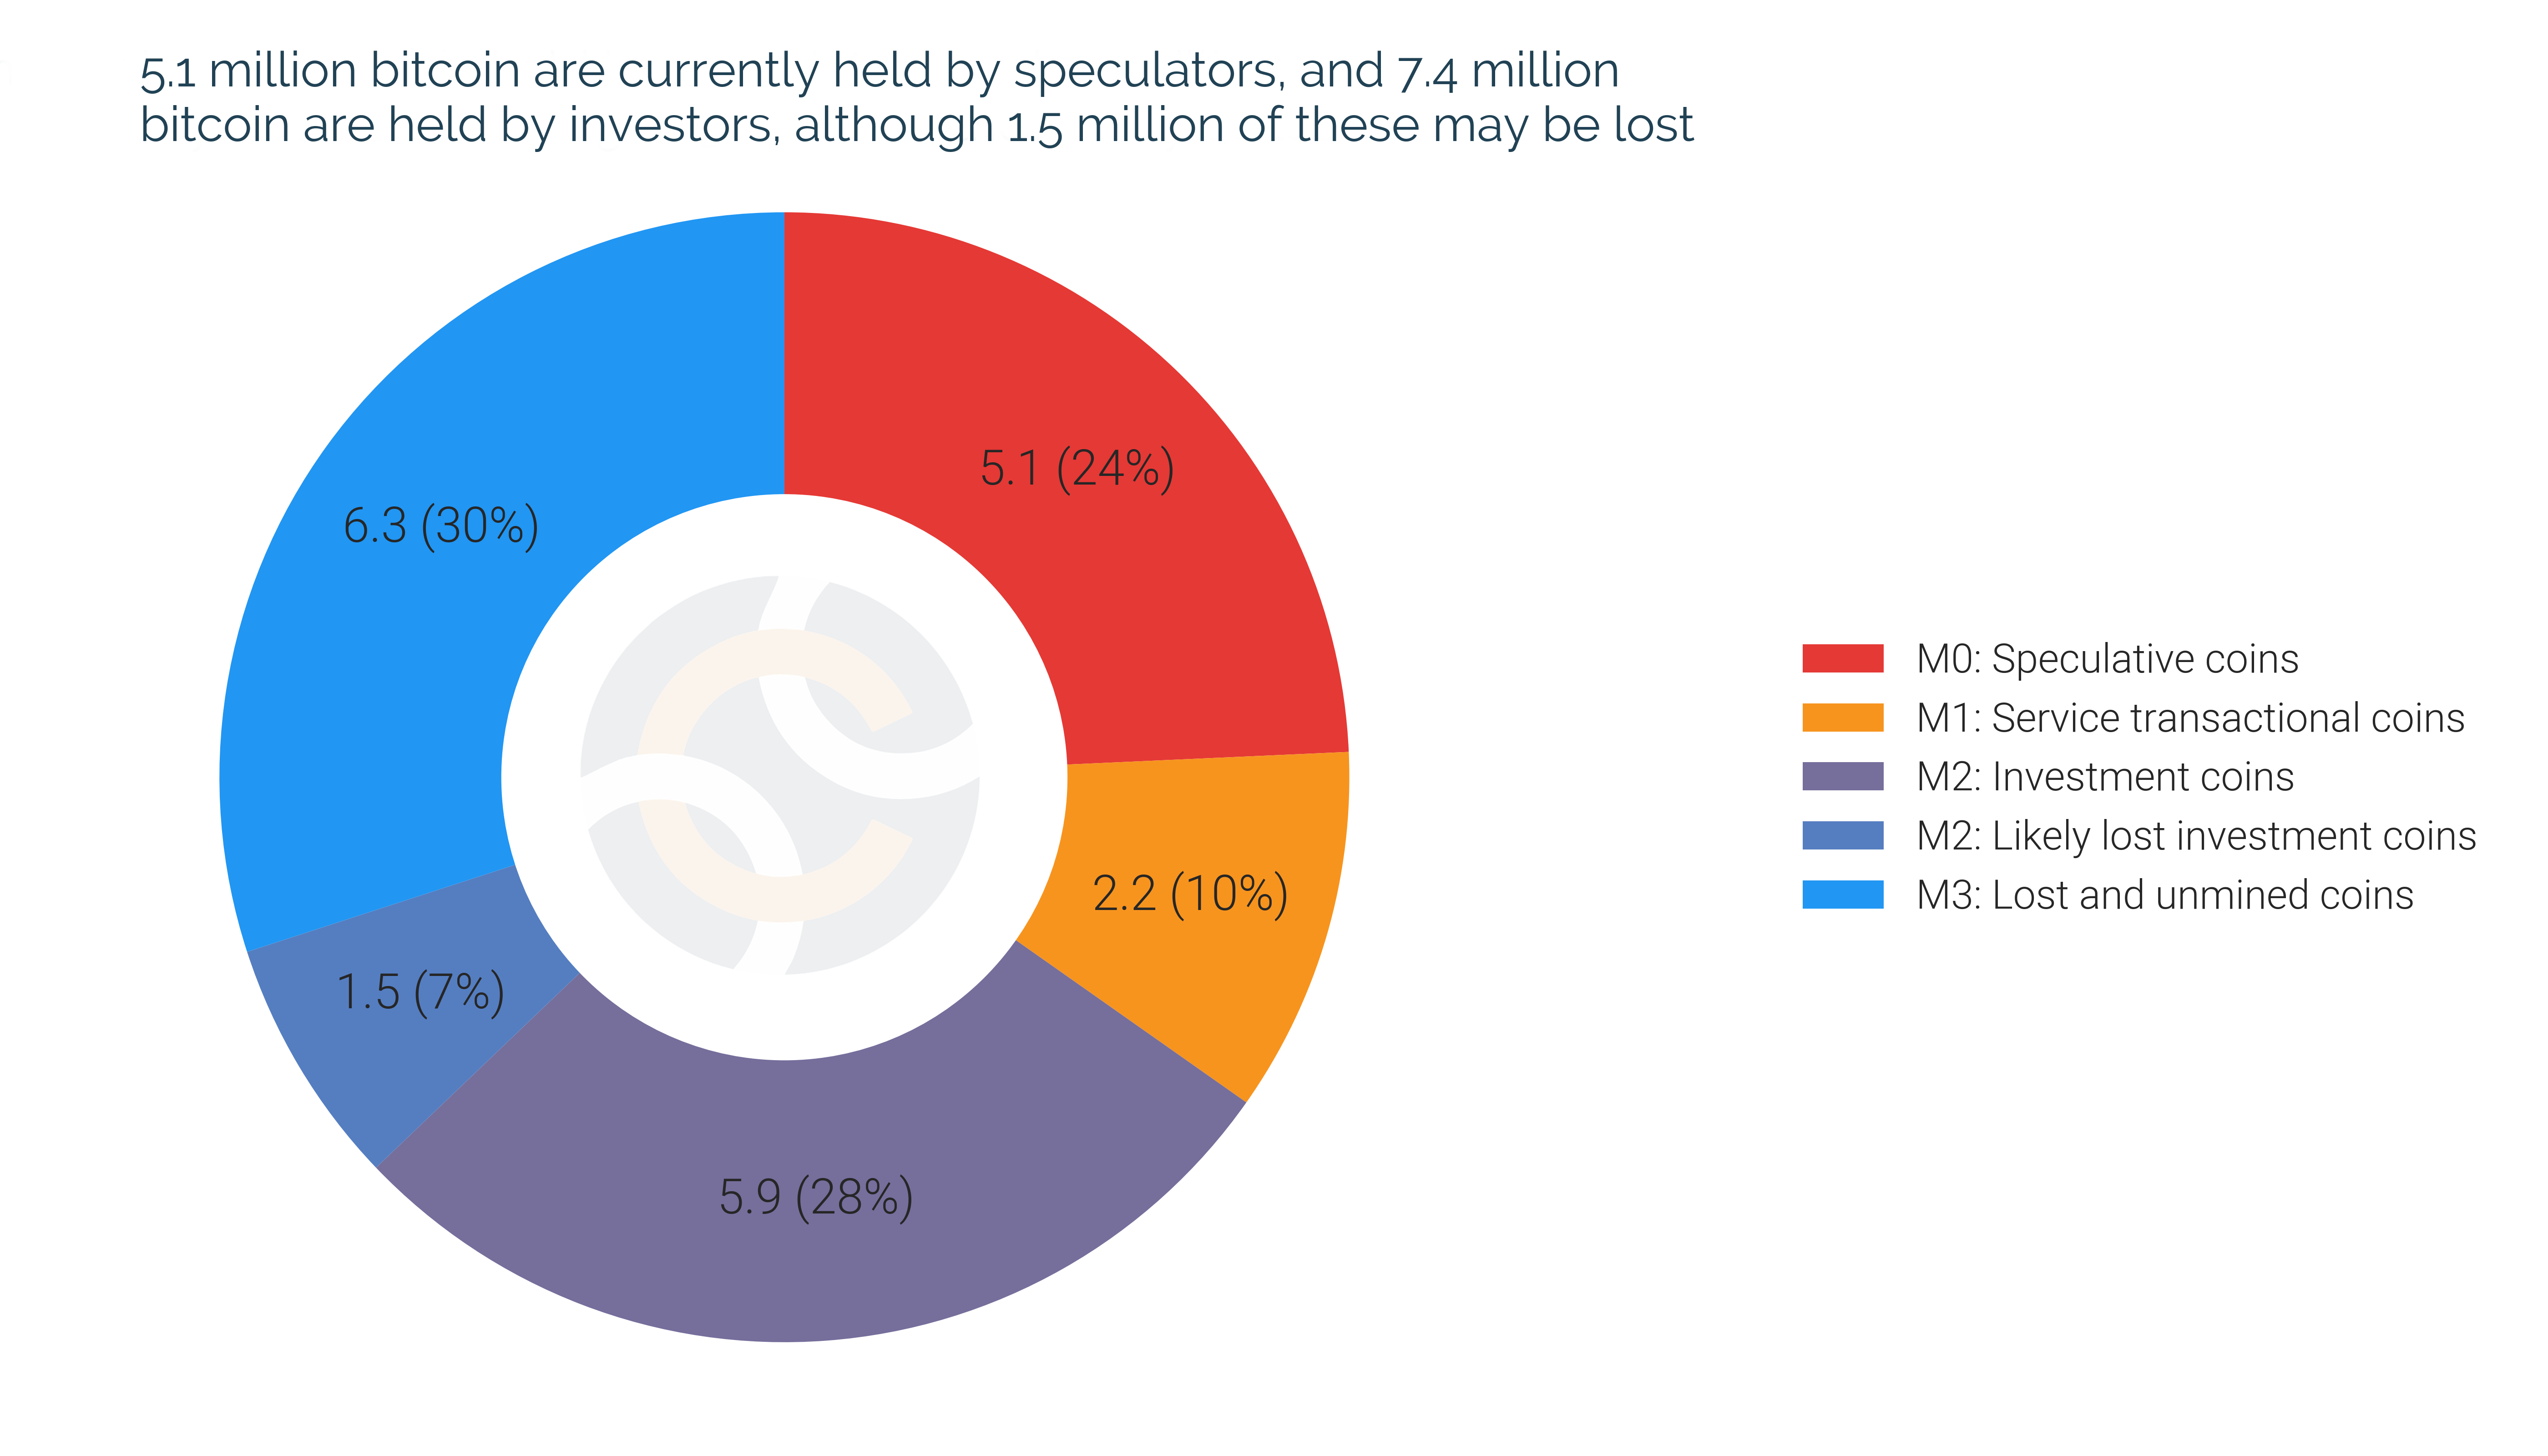
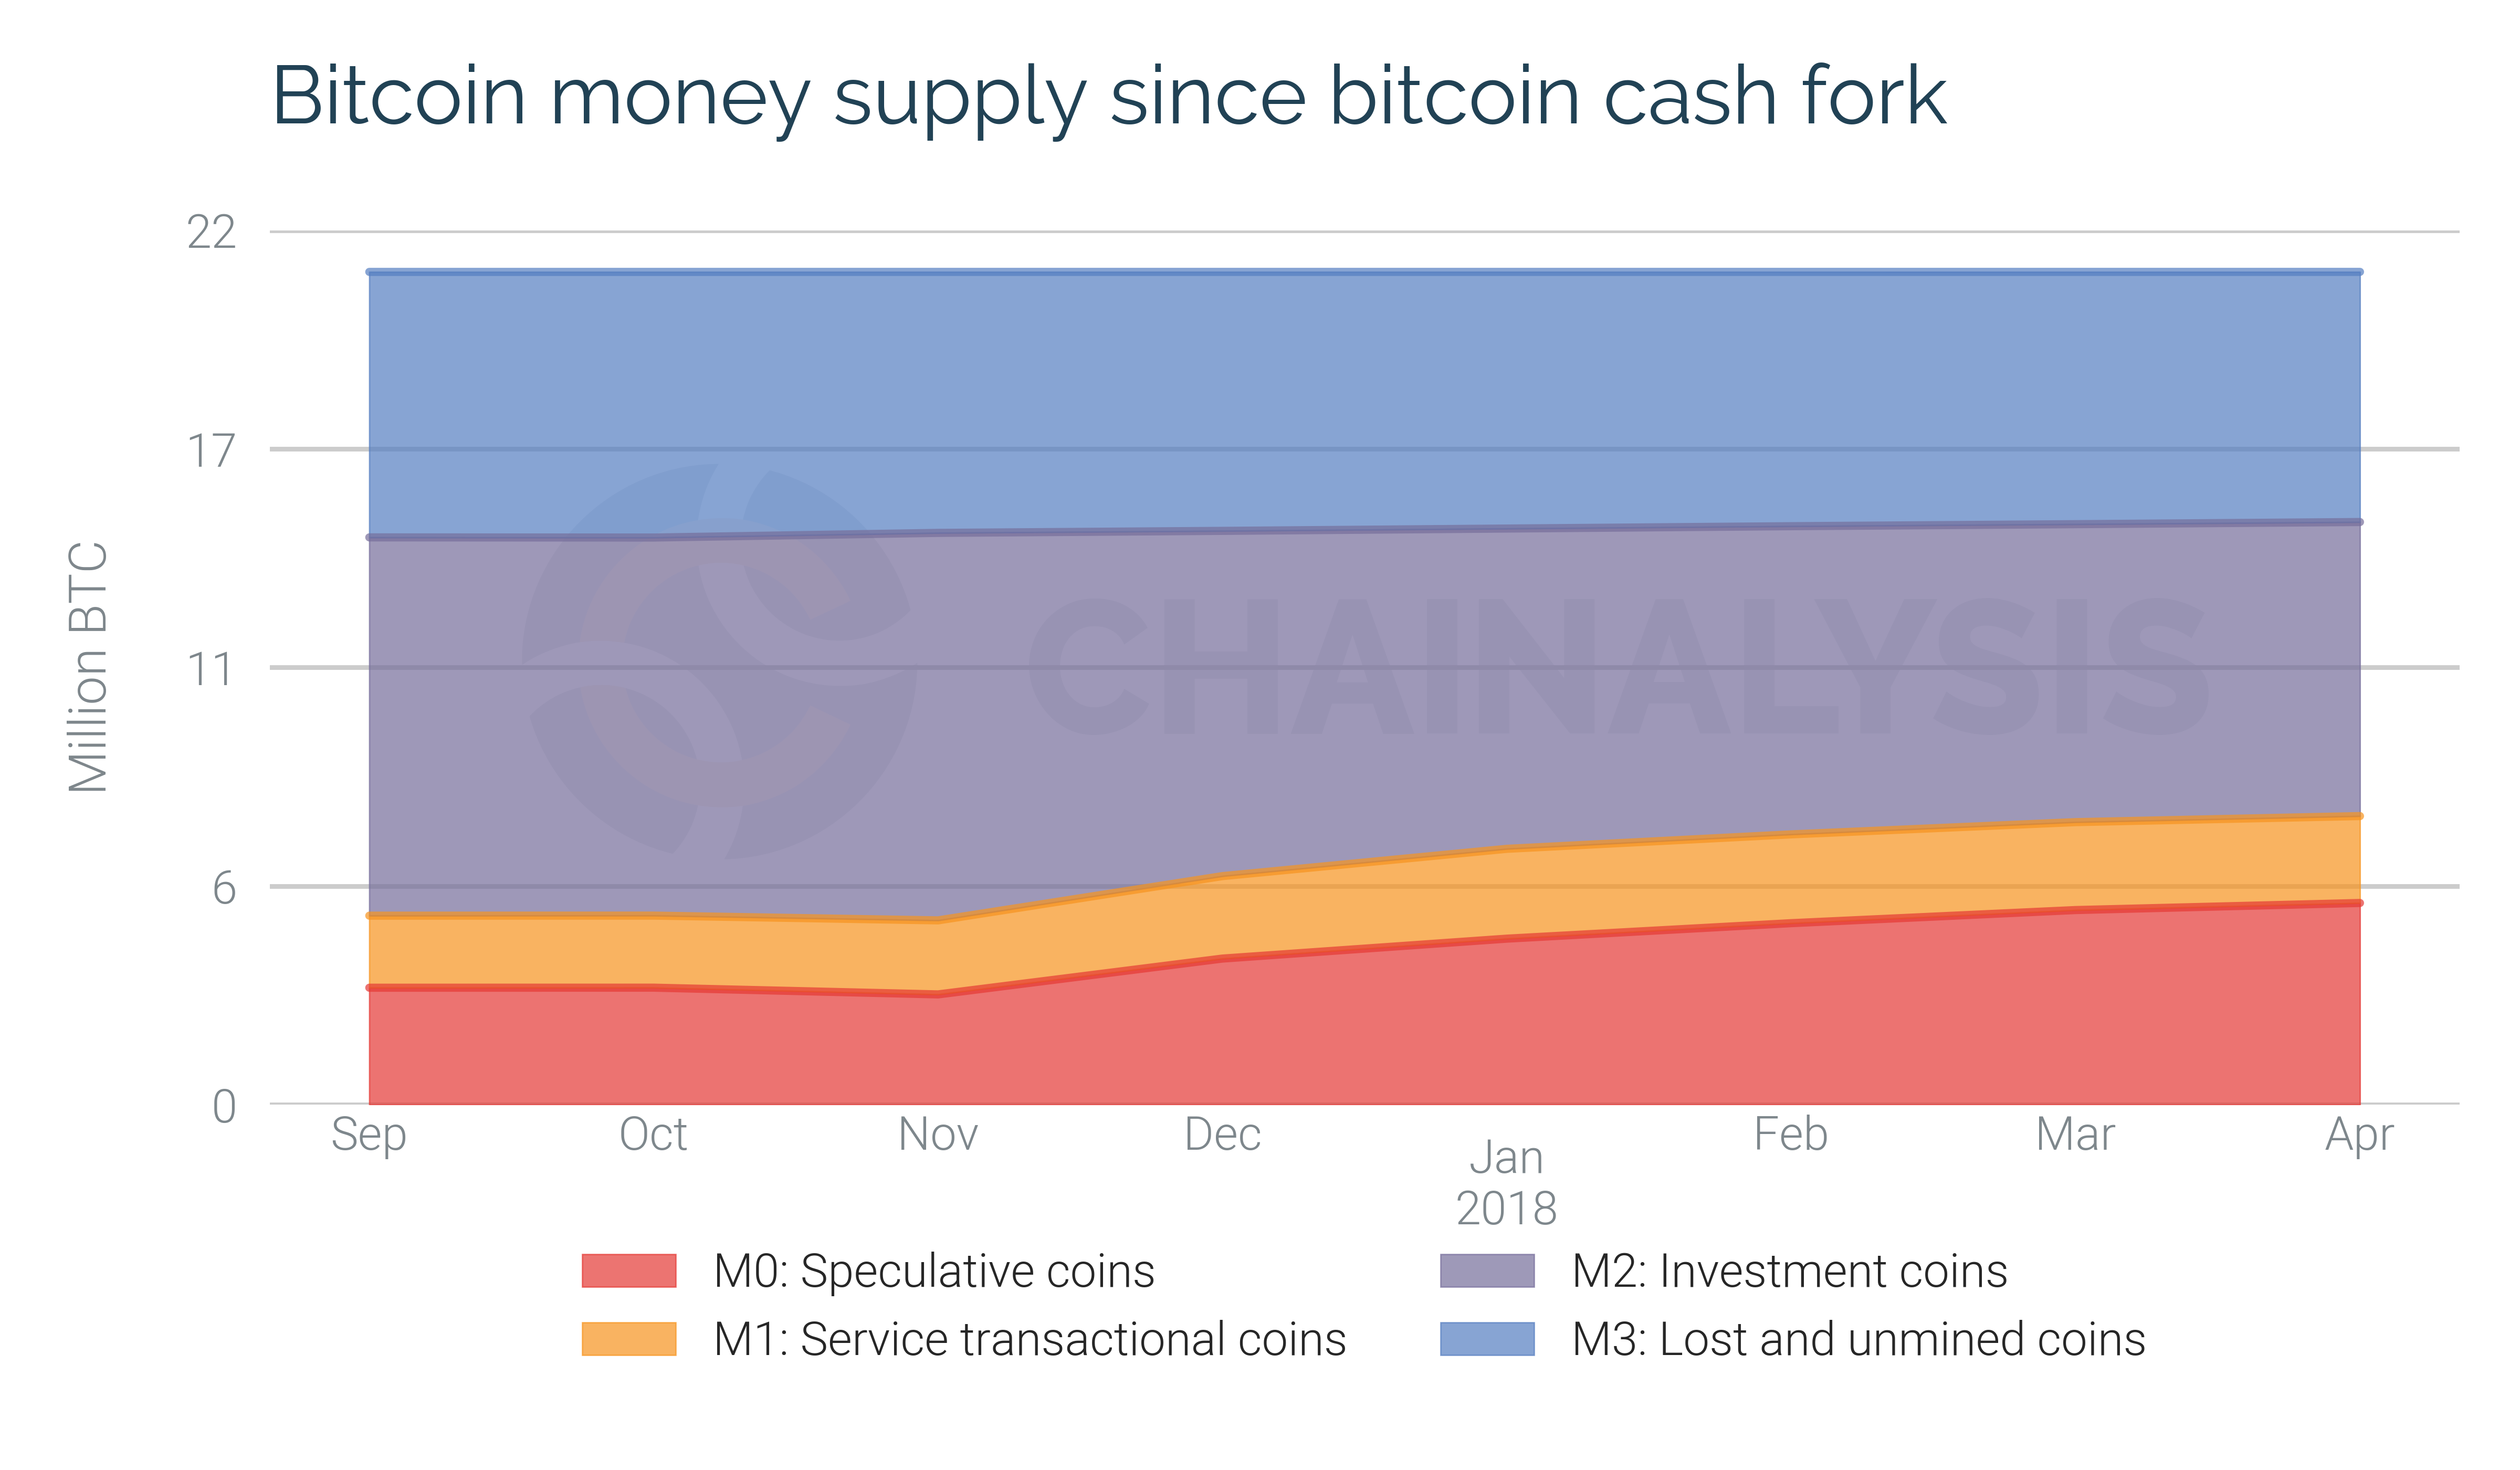
As of April 2018, of the 21 million bitcoin that will ever exist, around 4 million are currently unmined, at least 2.3 million are lost, 7.4 million are held as long term investments – of which a further 1.5 million could be lost, 2.2 million are held for transactions by services, such as exchanges, and 5.1 million are held for speculation.
Since September 2015, the majority of bitcoin has been held for investment, as shown in the chart below. However, this has declined in the last year, from 72% of available bitcoin in April 2017 to 50% in April 2018. At the same time, there has been an increase in bitcoin held for speculation, from 14% of available bitcoin in April 2017 to 35% in April 2018. This suggests that investors have cashed out some of their holdings. These bitcoin are now in the hands of new users who use their bitcoin to speculate or make personal transactions, rather than hold their bitcoin as a longer term investment.
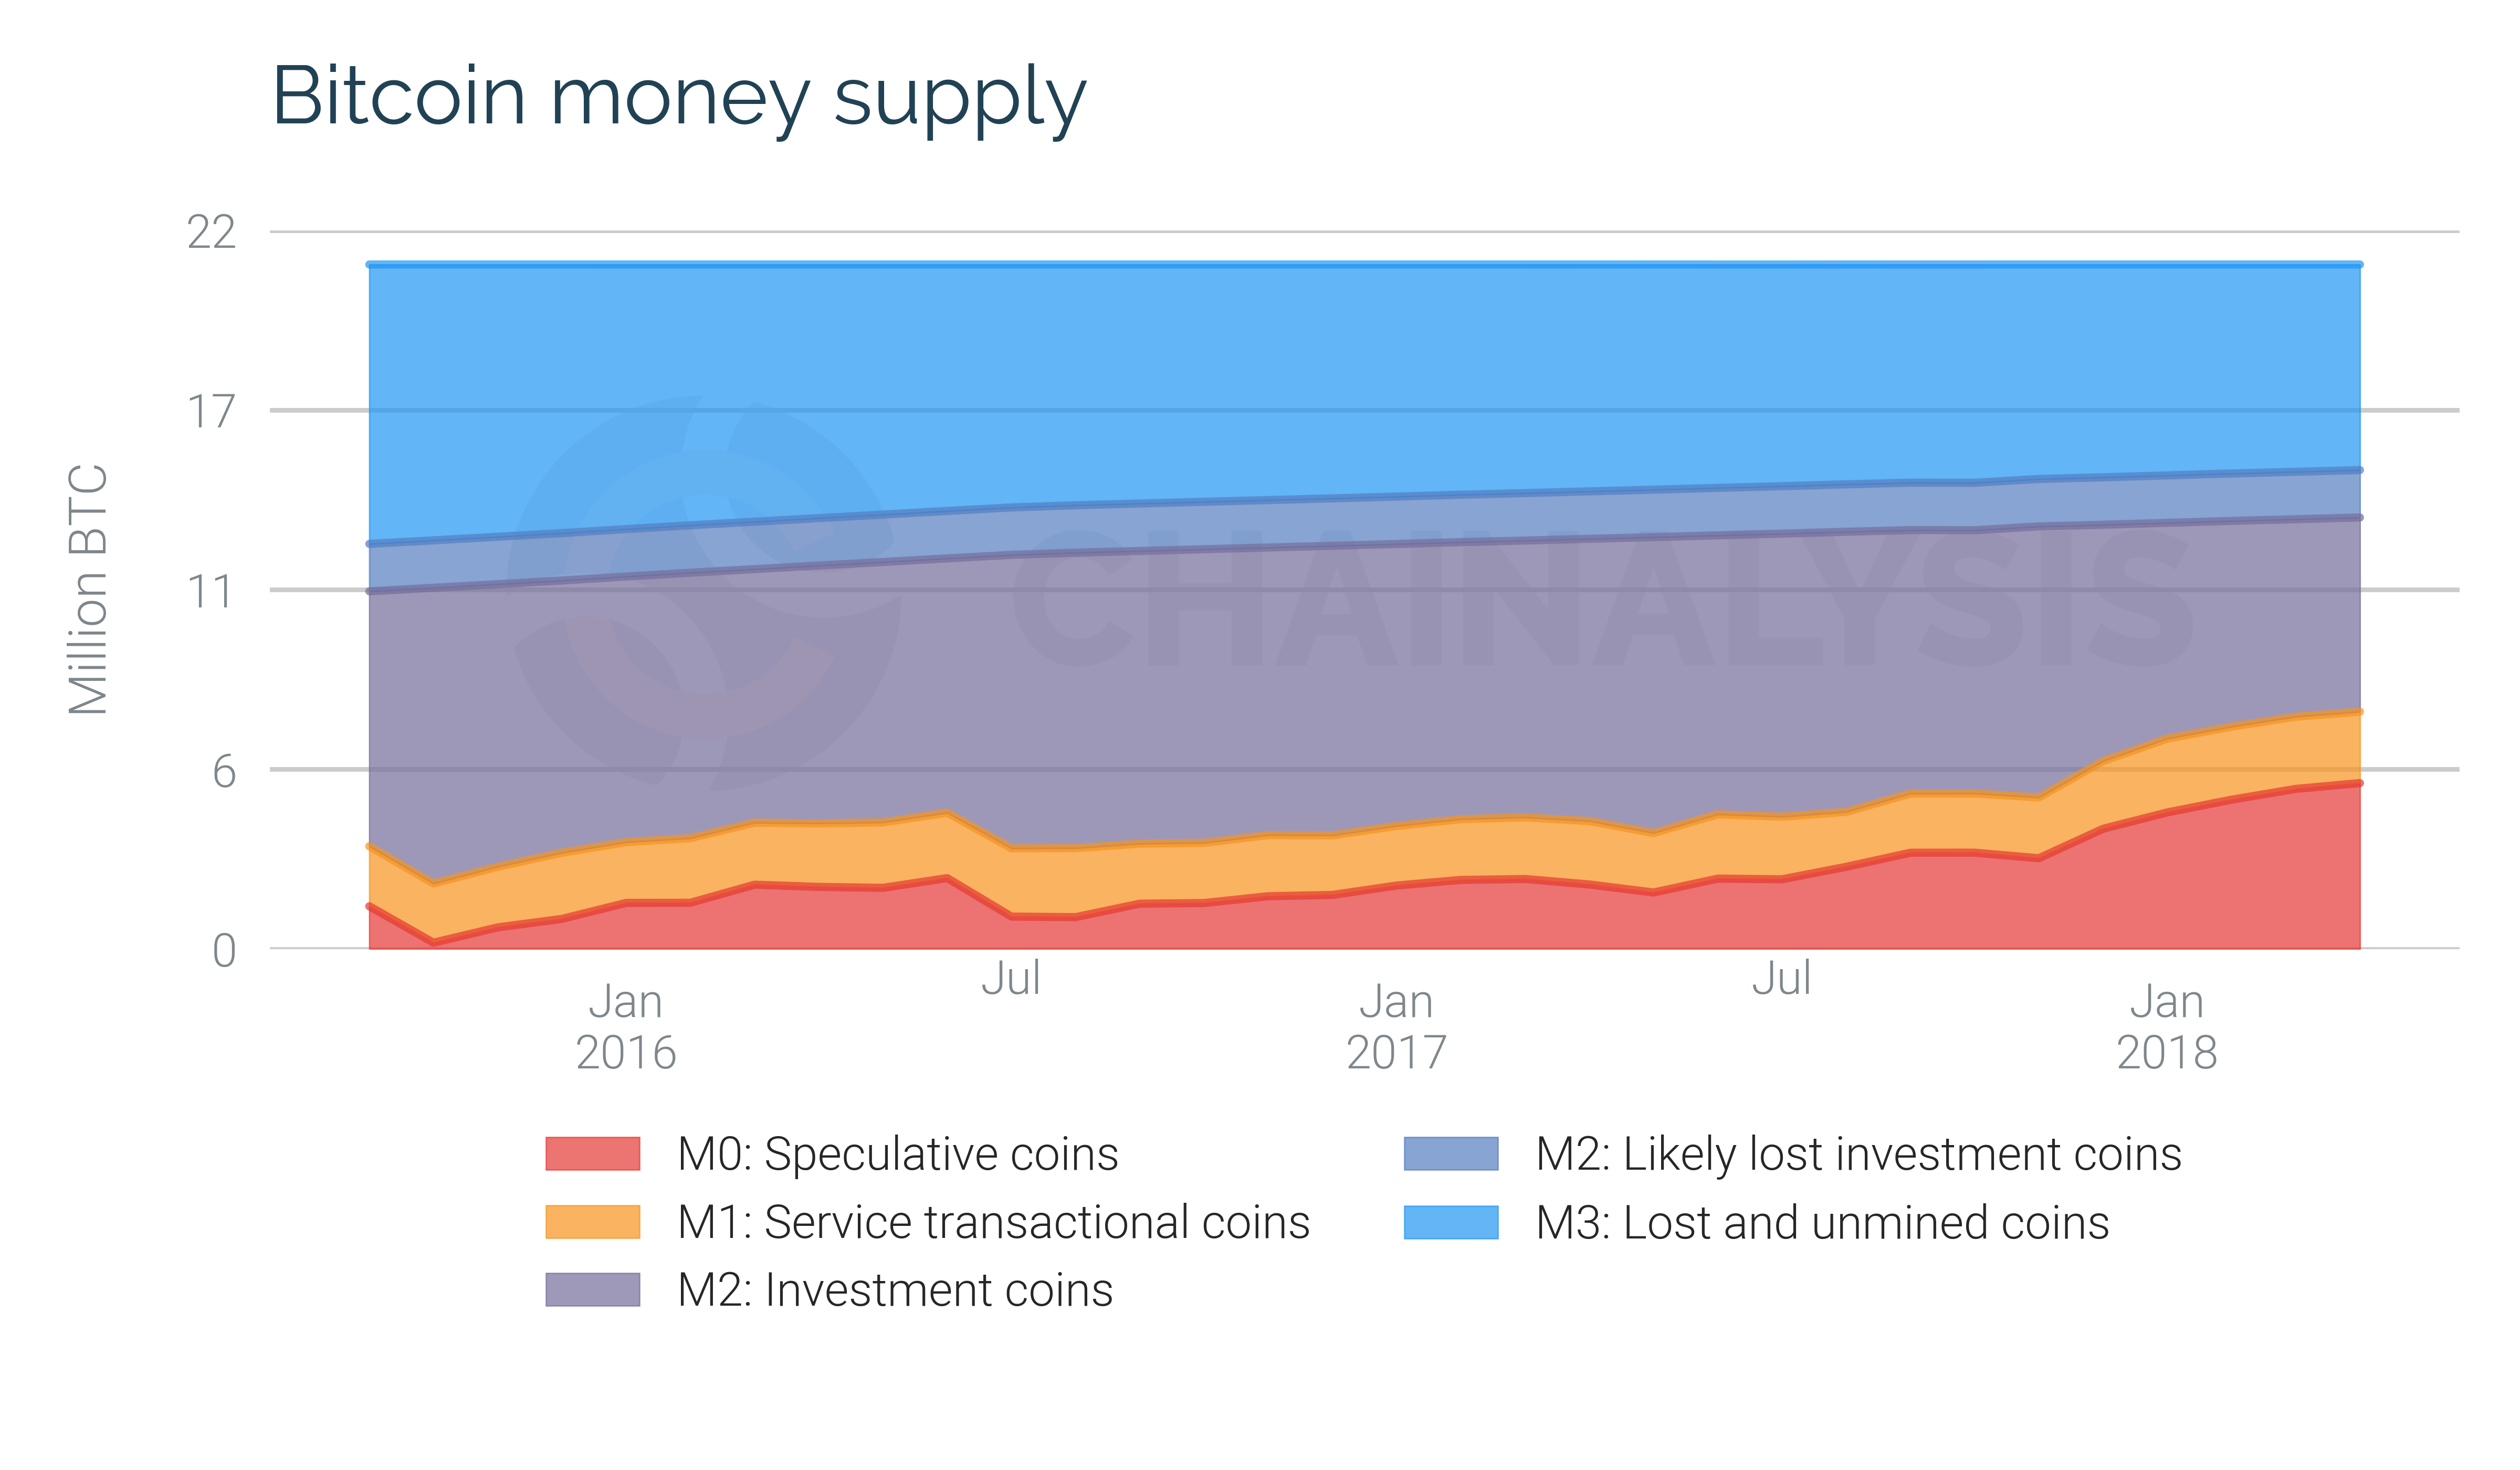
The amount of bitcoin held to make transactions by services, such as exchanges, merchant services and darknet markets, has remained stable over time, at around 15% of available bitcoin. This suggests that services manage their transactional wallets carefully, or could be a consequence of changes in the relative fortunes of services, such as the growth in exchanges offsetting declines in darknet markets, or of changes in Chainalysis’ coverage of such wallets.
Given that investment coins are the largest category, and that little is known about them as few people can accurately cluster addresses, we have explored the distribution of investor wealth. Investment coins, which includes HODLers, new investors, and service cold wallets, are highly concentrated in a small number of large wallets. As shown in the chart below, 3.5 million bitcoin, 45% of investment coins, are held in wallets of 1,000 bitcoin or more.
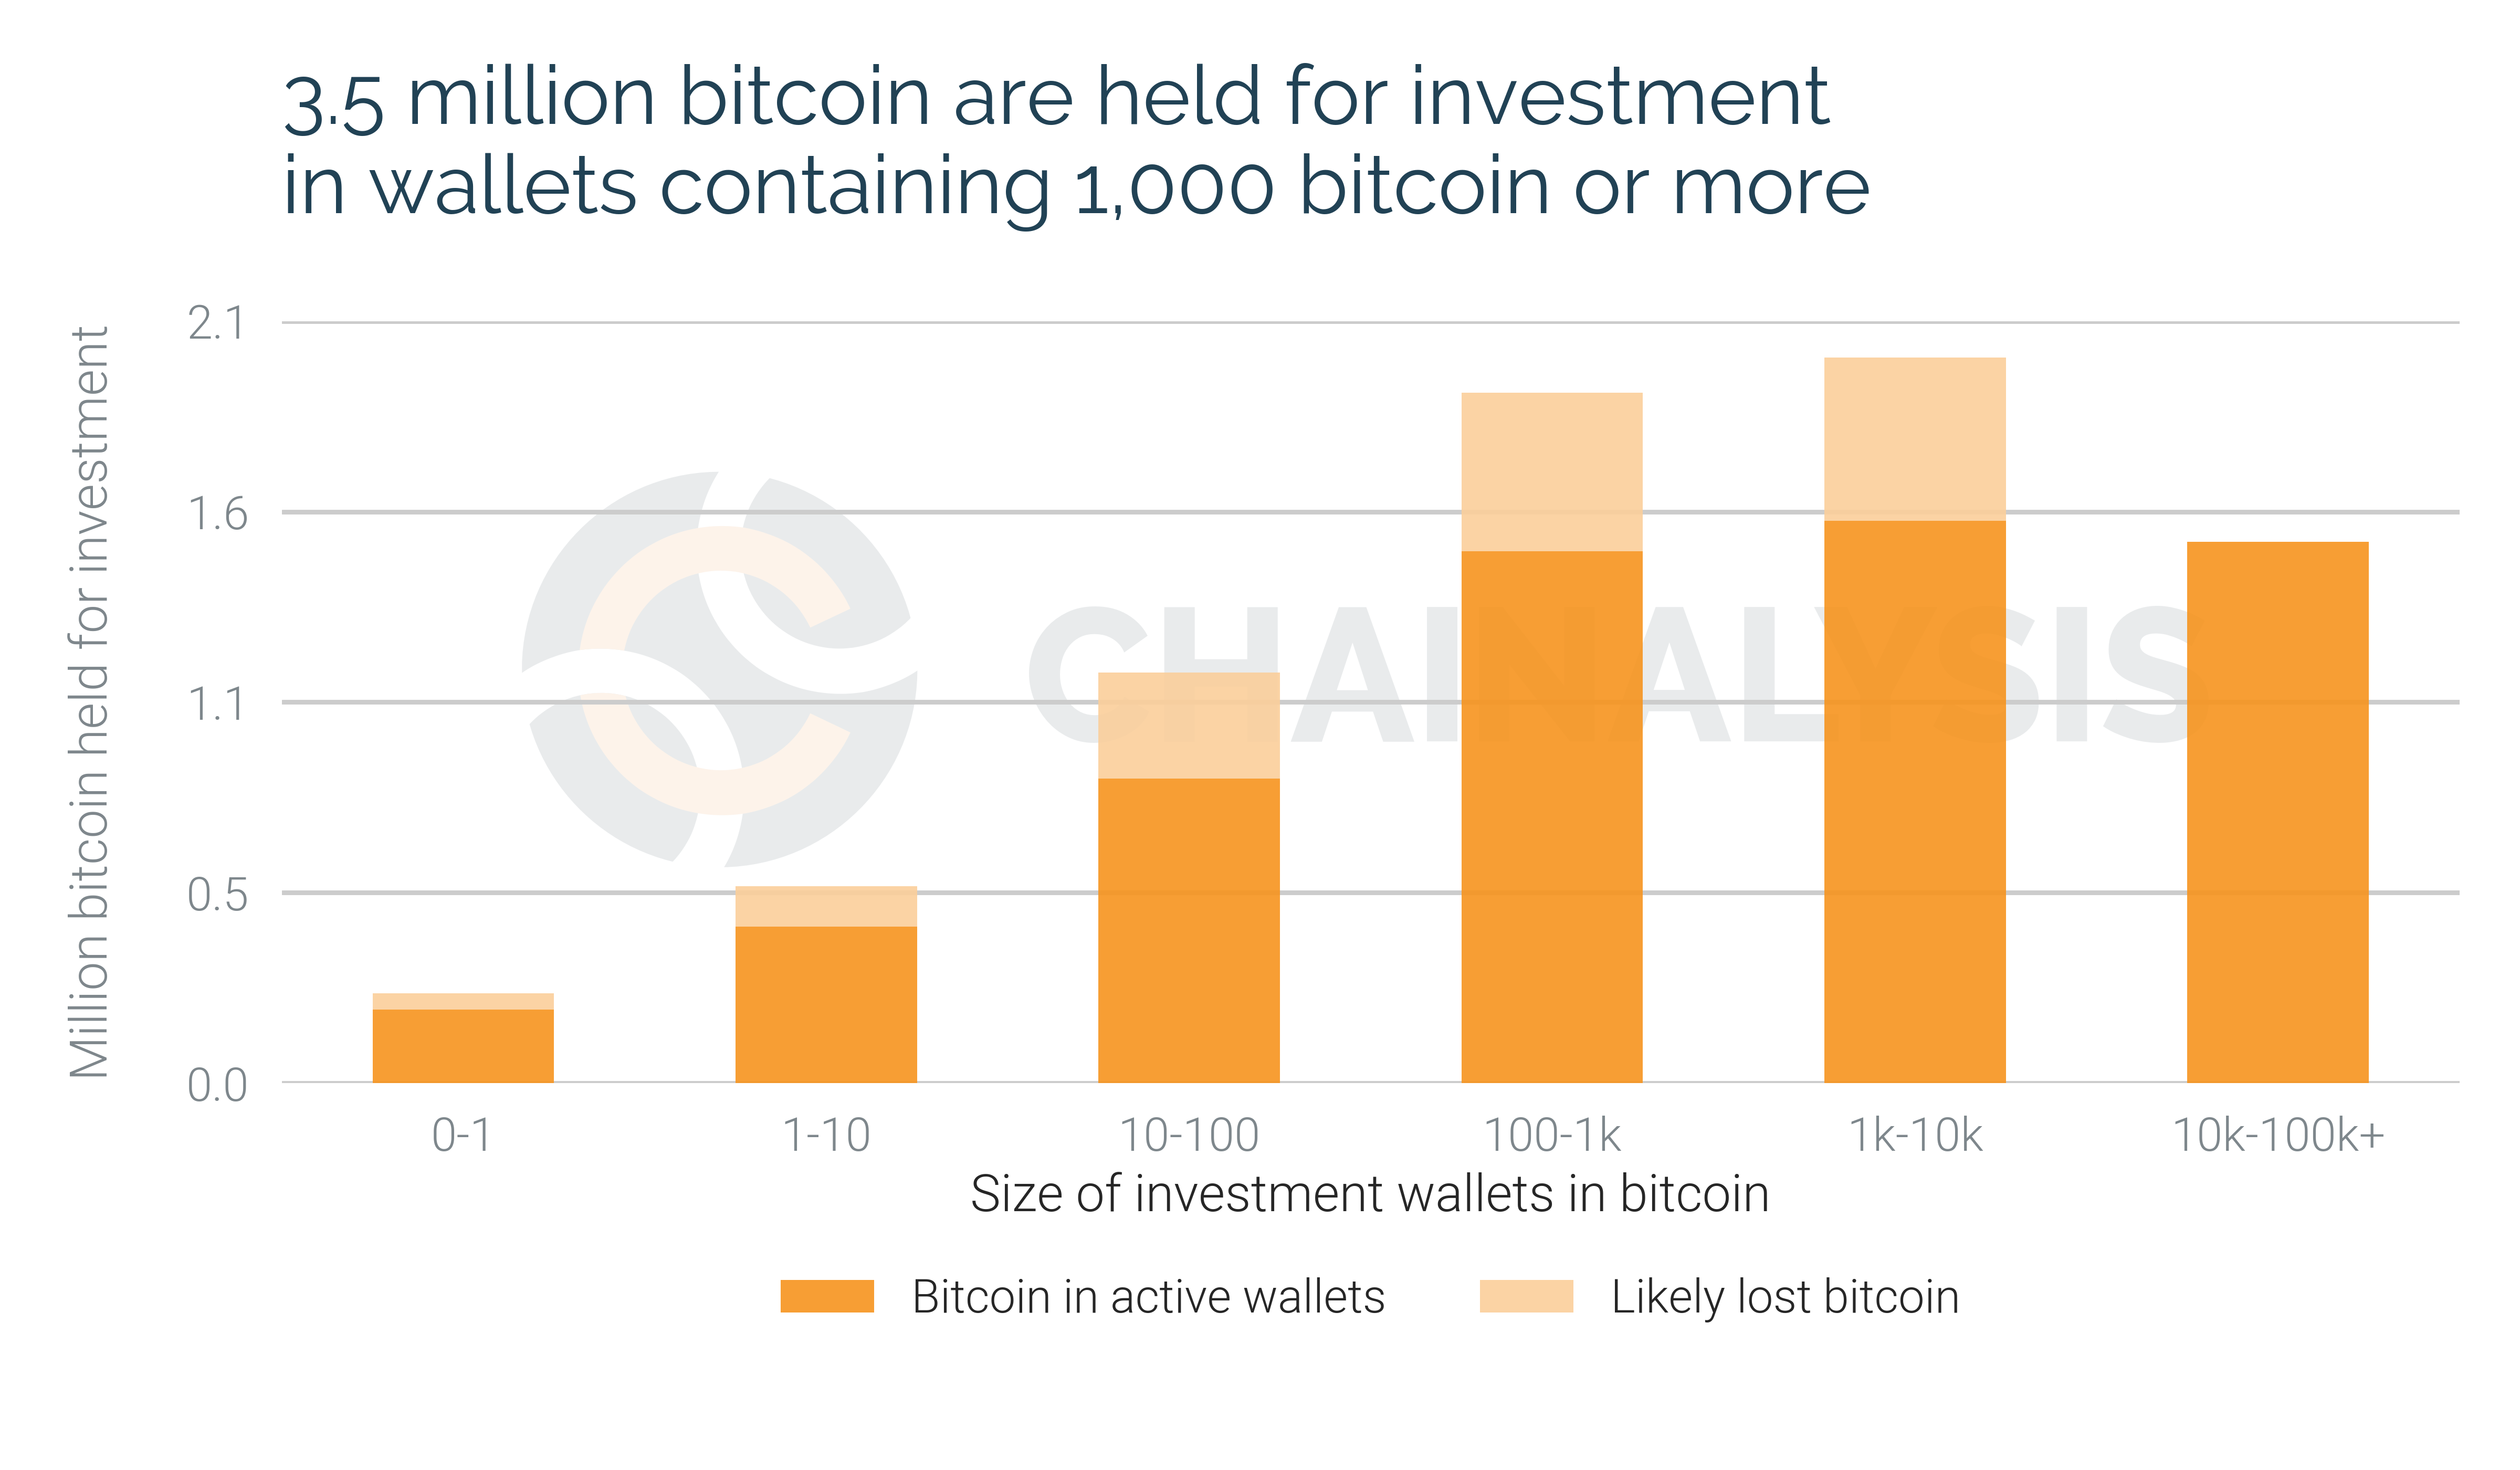
Not all of these investment wallets are active. An inactive investment wallet is one where all the bitcoin were collected before 2016 and the wallet has not spent any bitcoin since then. These inactive wallets are likely to be lost, and they contain 1.5 million bitcoin, distributed mainly in large wallets of between 100 and 10,000 bitcoin. Our methodology for estimating lost bitcoin can be found at the end.
Bitcoin velocity
PQ=MV is a popular, although imperfect, conceptual framework for evaluating cryptocurrencies. P is the USD price of bitcoin and Q is the number of bitcoin sent via on-chain transactions, so P multiplied by Q reflects the annual USD value of bitcoin transactions[3]. M is the money supply, the USD value of bitcoin available for transactions, and V is the velocity, the average number of times a bitcoin was spent in a year.
We find that when the money supply, M, includes investment, transactional and speculative coins, the velocity, V was 8.7 in 2016, and has been stable over time, as shown by the orange line in the chart below. This is close to Chris Burniske’s estimate that in 2016 the velocity of bitcoin was 6.5. However, if investment coins are excluded from M, which is reasonable as investment coins are not used to make transactions, then the velocity of bitcoin has been 26.4 on average over 2016 and 2017, as shown by the dark blue line.
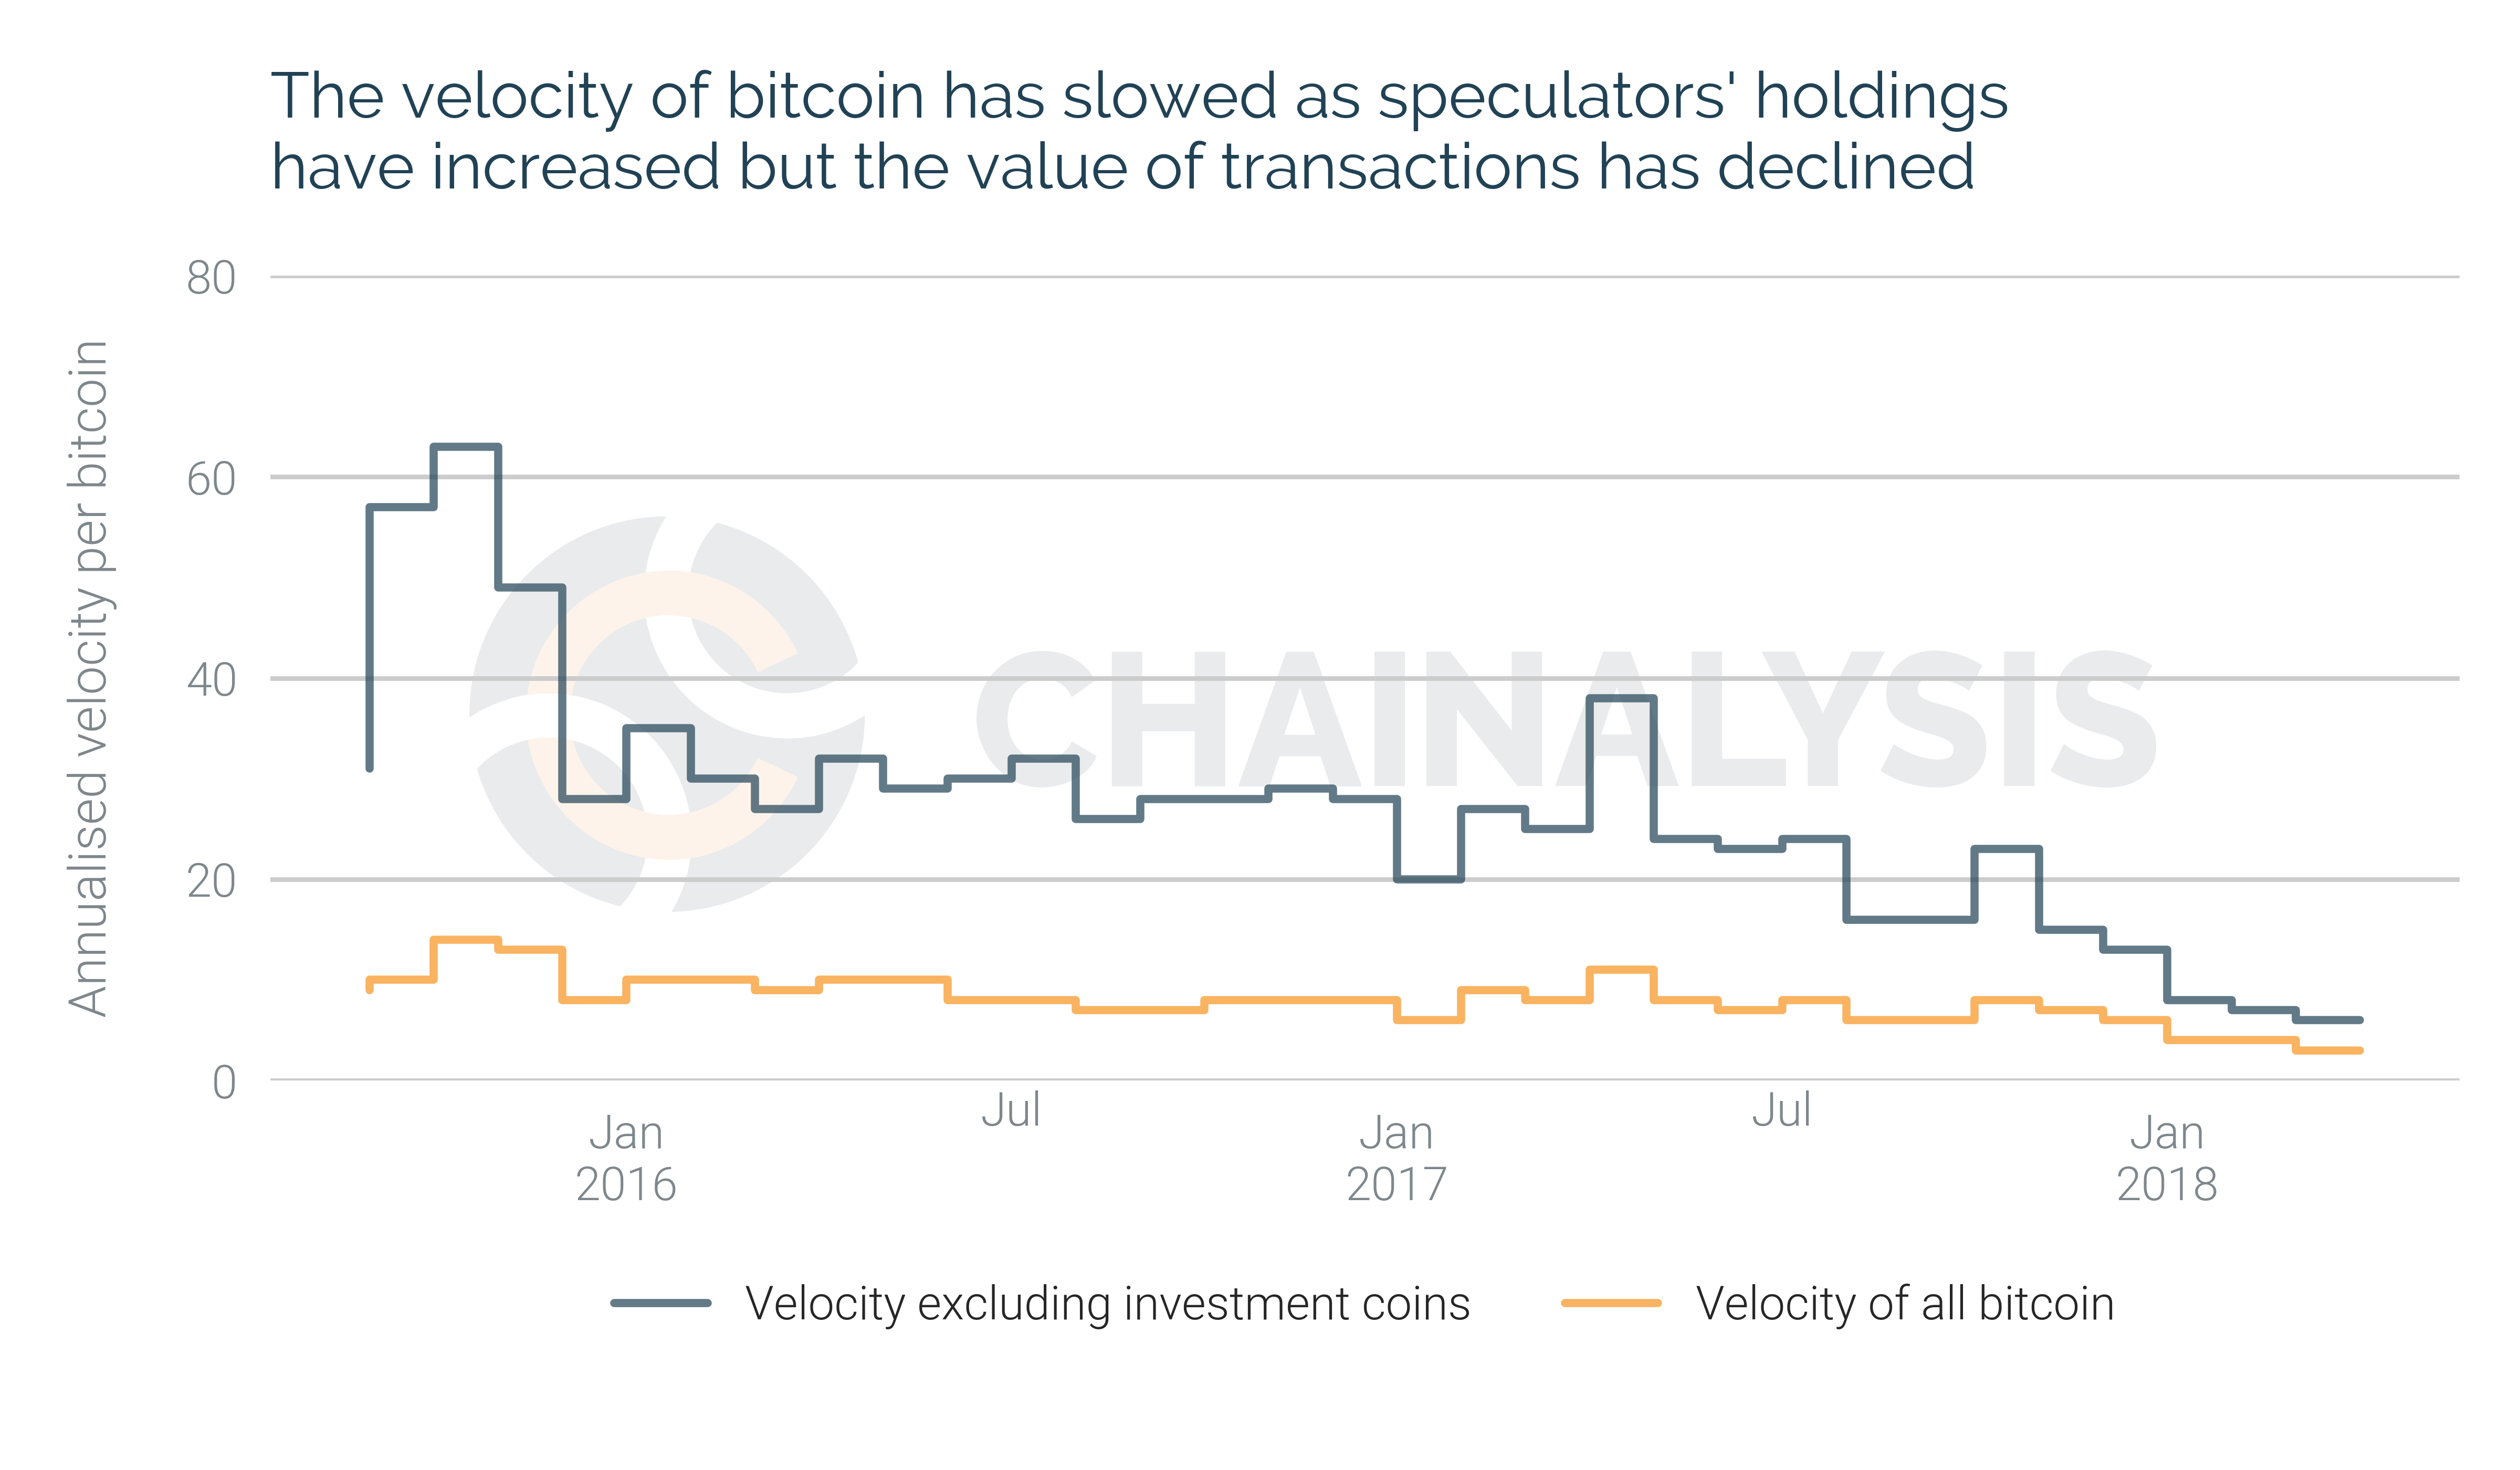
Furthermore, the velocity of bitcoin, across both definitions of money supply, has been slowing since January 2018. The average velocity from January to April 2018 has fallen to 8.5 on a money supply of transactional and speculative coins only and 4.4 on a money supply of all available bitcoin. This decline in velocity in 2018 so far is due to an increase in short term speculators and a decline in transaction volumes. Either economic activity in bitcoin will pick up, if new use cases develop or new users enter – perhaps induced by a price fall, or these new speculators will inadvertently become HODLers.
Bitcoin cash money supply
Central banks use monetary aggregates to inform monetary policy. The crypto equivalent of monetary policy is protocol design. For example, bitcoin cash has larger blocks to support higher levels of transactions than bitcoin.
Given this, it is relevant to understand whether there is more bitcoin cash held by transactional users than in bitcoin. While this comparison may not be direct given that bitcoin cash is much younger than bitcoin, it appears that there are far fewer transactional users of bitcoin cash than in bitcoin. 1.5 million bitcoin cash are held for speculation and transactions compared to 7.3 million bitcoin. As shown in the chart below, the ratio of transactional to investment coins in bitcoin is 1:1, while the ratio for bitcoin cash is 1:10.
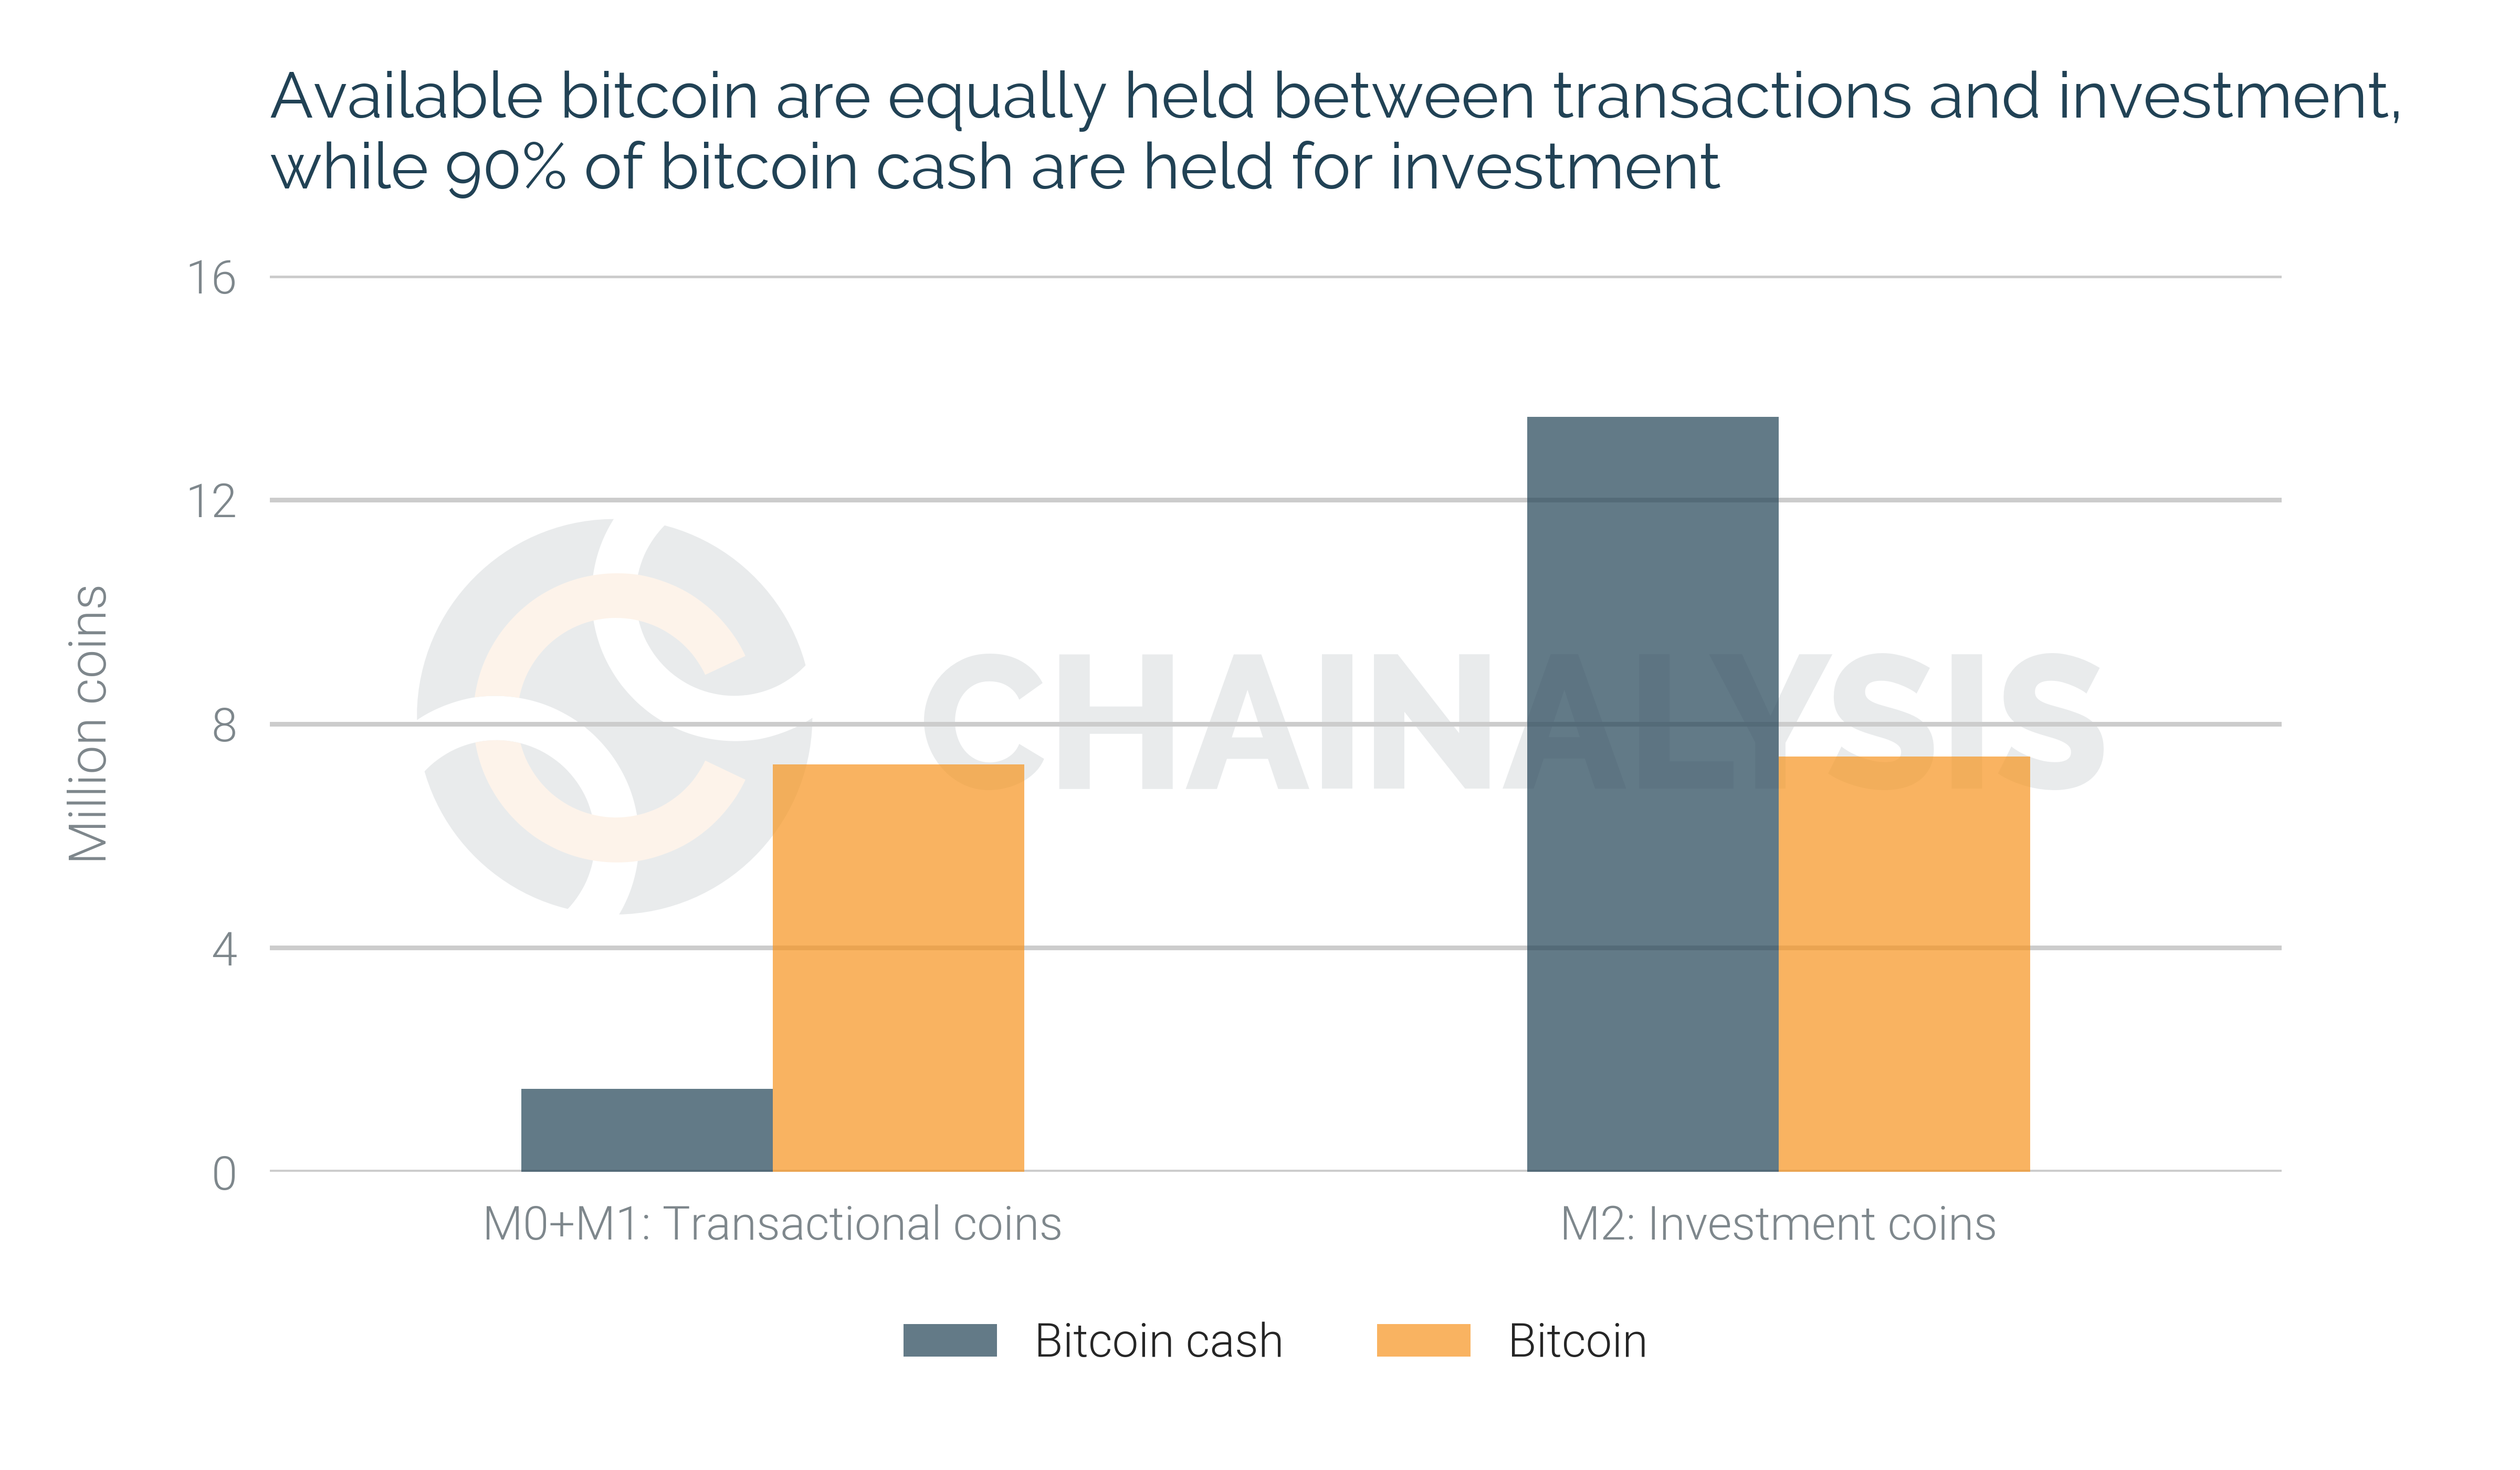
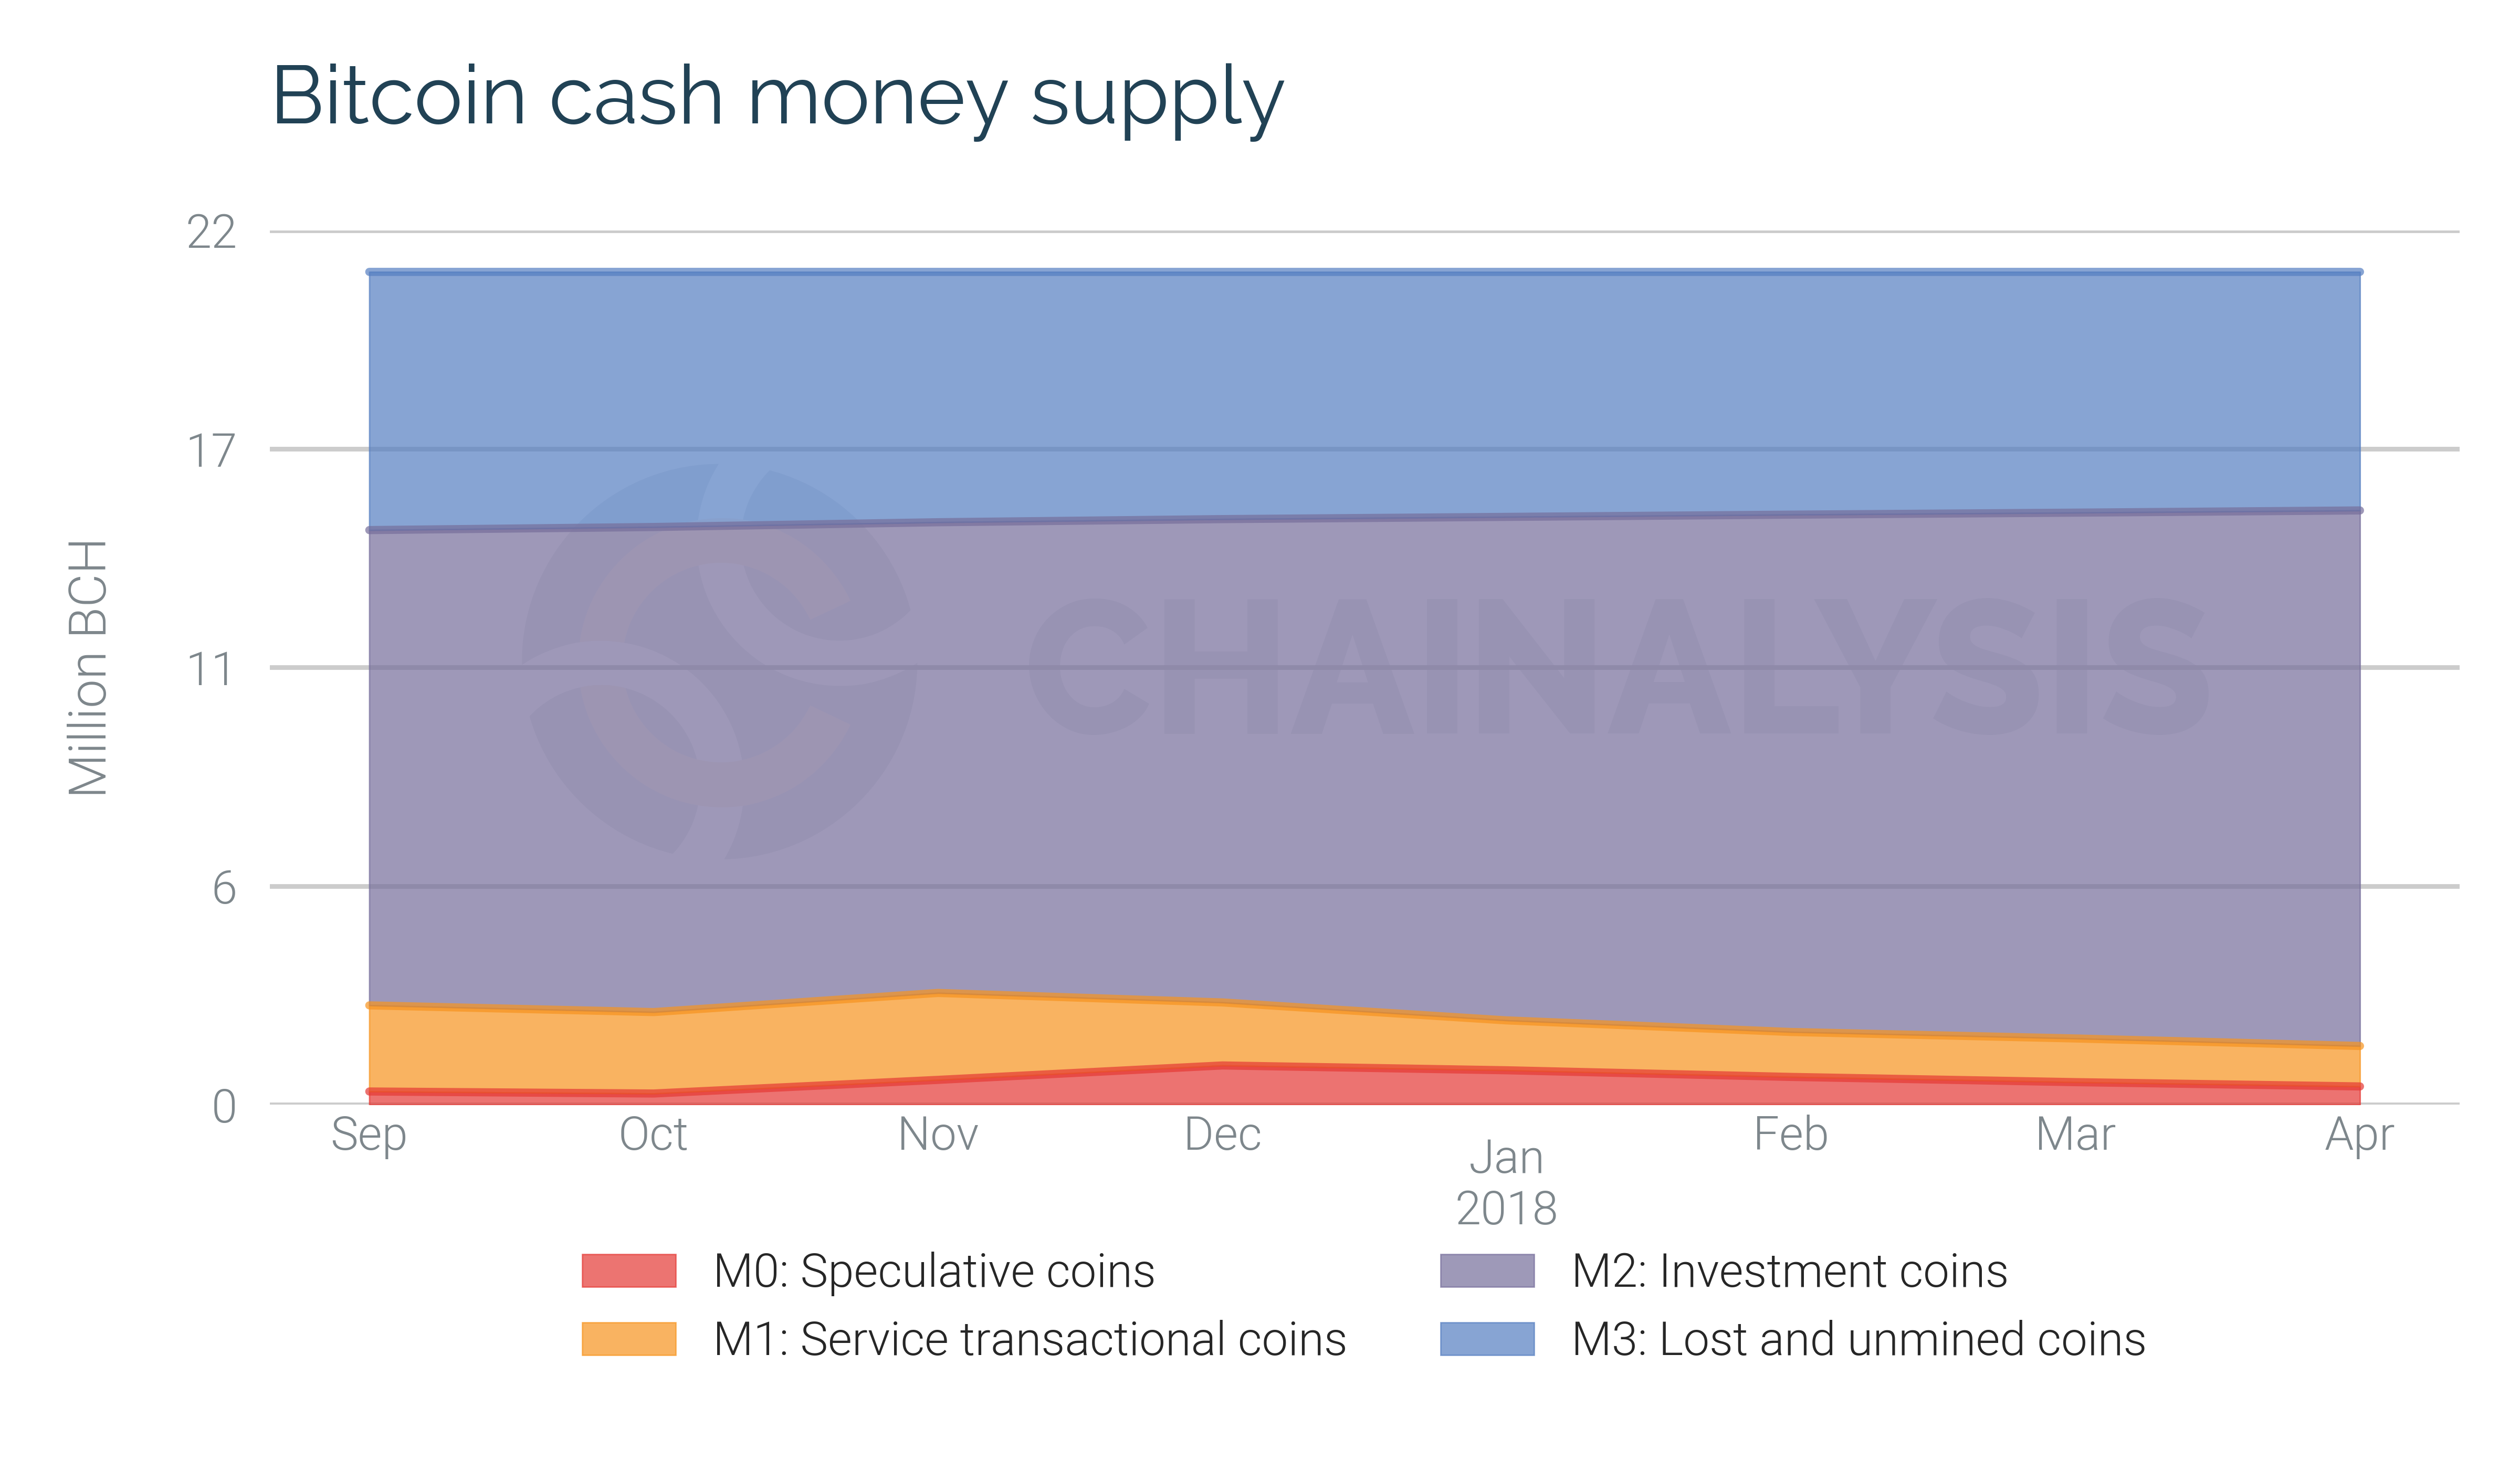
Furthermore, the transactional bitcoin cash held by services has declined, from 15% in November 2017 to 7% in April 2018. This is likely due to exchanges starting to list bitcoin cash, allowing individuals to sell off their bitcoin cash. This bitcoin cash has ended up being held by investors, rather than by people using bitcoin cash for speculation or transactions. As shown by the charts below, which compare the bitcoin cash money supply with the bitcoin money supply since the fork, this is in contrast to bitcoin, which is increasingly held by speculators.
Definitions of monetary aggregates
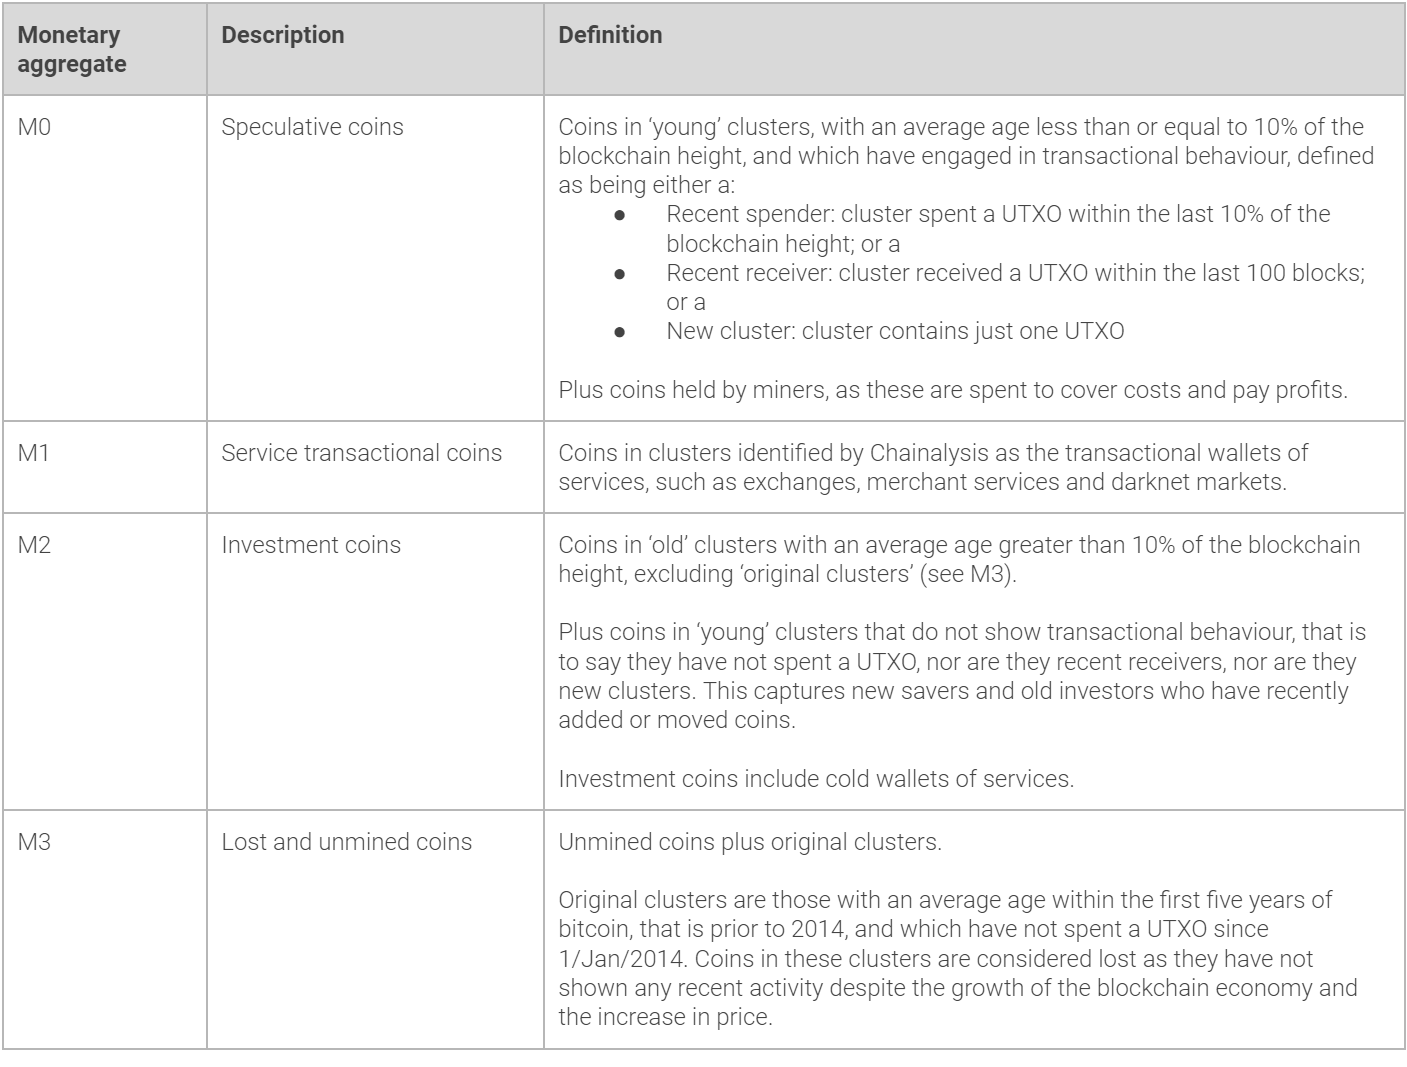
Table Notes
Definitions are rule based, applied to Chainalysis’ structured dataset of blockchain clusters, but categorisation has also been subject to human and heuristic checks.The average age of a cluster is the average time the transaction outputs in a cluster have been unspent, weighted by the bitcoin value of these unspent transaction outputs (UTXOs).As of May 2018, 10% of the blockchain height is 1 year for bitcoin and 1 month for bitcoin cash, as the blockchains are 10 years and 10 months old respectively.A UTXO is an Unspent Transaction Output.The definition of investment clusters, which includes HODLers, as those with an average age greater than 10% of the blockchain height, once the blockchain is older than five years, is a round approximation, based on our observations, of the period of time after which cluster behaviour is stable. It is necessary to define the category dynamically, that is using a percentage rather than a fixed time period, as the economy on a particular blockchain is dynamic, and because different blockchains have different ages, so a relative measure is required.
Methodology for estimating the number of lost bitcoins
Bitcoin can be lost if the private keys to wallets are lost. Anecdotally, we know this occurs. However, a systematic understanding of lost bitcoin requires assumptions and estimation. This is because people do not always announce they have lost their keys and such declarations may not always be honest. So to estimate lost bitcoin, we rely on observing how old the bitcoin in a wallet are and how long it has been since the wallet spent bitcoin. We then make assumptions that inactivity for a period of time suggests the wallet is lost. For example, we assume wallets that contain bitcoin with an average age prior to 2014 and that have not spent any bitcoin since the start of 2014 are lost.
In November 2017, Chainalysis provided the first systematic estimation of lost bitcoin. That analysis relied on finding the age of Unspent Transaction Outputs (UTXOs) and assuming that old UTXOs were lost. Since then, we have calculated the age of clusters, our approximation of a single entity’s wallet. This provides a more accurate estimate of lost bitcoin. Wallets contain UTXOs, and some UTXOs could be old and some young, or recently spent. Our previous analysis would have classified the old UTXOs in a wallet as lost, even though they belonged to an active wallet, that is a wallet with young or recently spent UTXOs. Our November 2017 analysis estimated that between 2.8 million and 3.8 million bitcoin are lost. Due to our new, more accurate, methodology of estimating lost bitcoin, based on wallets rather than UTXOs, we now estimate that between 2.3 million and 3.7 million bitcoin are lost.
The lower bound estimate of 2.3 million lost bitcoin is composed of two parts. The first part is the 2.1 million bitcoin in ‘original clusters’. These are wallets with an average age within the first five years of bitcoin, that is prior to 2014, and which have not spent a UTXO since the start of 2014. Coins in these clusters are considered lost as they have not shown any recent activity despite the growth of the crypto-economy and the increase in price. The choice of 2014 as the boundary for lost bitcoin is a judgement based on our analysis of the cohorts of bitcoin holders over time. For those wishing to understand this further, we recommend the analysis from the team at Unchained Capital on the changing age stratification of UTXOs over time.
The second part of our lower bound estimate is the 0.2 million bitcoin that we estimate has been lost by active users, for example by misdirected transactions or loss of private keys by new users, extrapolated from our database of such reports.
The upper bound estimate of 3.7 million bitcoin adds 1.455 million lost bitcoin to the 2.257 million lower bound estimate. So in round numbers: an additional 1.5 million bitcoin is added to 2.3 million bitcoin, giving an upper bound of 3.7 million bitcoin with an error due to rounding. The additional lost bitcoin in our upper bound estimate comes from wallets with an average age greater than two years, that is prior to April 2016, and which have not spent a UTXO since April 2016. That is to say we extend our time boundary for lost bitcoin from the start of 2014 to April 2016.
Glossary
[1] At Chainalysis, our fundamental unit of the crypto economy is the cluster. A cluster is our best estimation of the addresses included in a single entity’s wallet. We create clusters by analyzing the blockchain data of a cryptocurrency using a set of rules that take into consideration properties such as spending patterns, address relationships, and transaction structure (to name a few).
[2] It is hard to know the extent to which bitcoin futures are currently hedged, but even if they were fully hedged then only tens of thousands of bitcoin would be required.
[3] We use blockchain.info’s estimated USD transaction value for PQ
