This blog is an excerpt from the Chainalysis 2021 Crypto Crime Report. Click here to download the whole thing!
Money laundering is the key to cryptocurrency-based crime. The primary goals of cybercriminals who steal cryptocurrency, or accept it as payment for illicit goods, are to obfuscate the source of their funds and convert their cryptocurrency into cash so that it can be spent or kept in a bank. Of course, thanks to the efforts of law enforcement and compliance professionals around the world, cybercriminals can’t simply send their ill-gotten cryptocurrency to an exchange and cash out as a normal user would. Instead, they rely on a surprisingly small group of service providers to liquidate their crypto assets. Some of these providers specialize in money laundering services while others are simply large cryptocurrency services and money services businesses (MSBs) with lax compliance programs. Investigators could significantly damage cybercriminals’ ability to convert cryptocurrency into cash by going after these money laundering service providers, thereby reducing the incentives for cybercriminals to use cryptocurrency in the first place.
Who are these money laundering service providers? First, let’s look at the services that have received funds from criminal sources over the last few years.
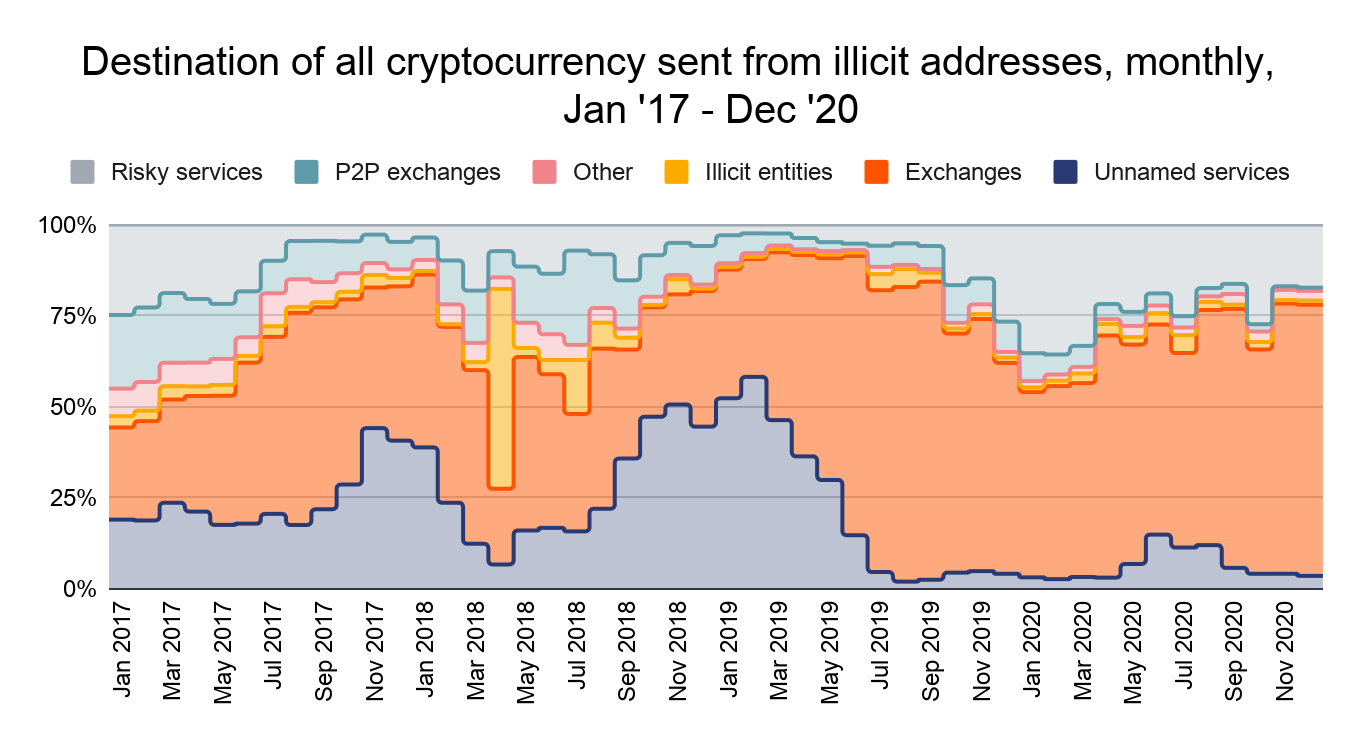
Historically, mainstream exchanges have been the primary destination of illicit cryptocurrency, and that didn’t change in 2020. In fact, the share of all illicit cryptocurrency received by exchanges grew slightly in 2020.
We also see significant volume moving from illicit addresses to services we categorize as “risky,” including high-risk exchanges, gambling platforms, mixers, and services headquartered in high-risk jurisdictions. Interesting trends arise when we look at the specific risky services receiving funds from different types of cryptocurrency-based crime.
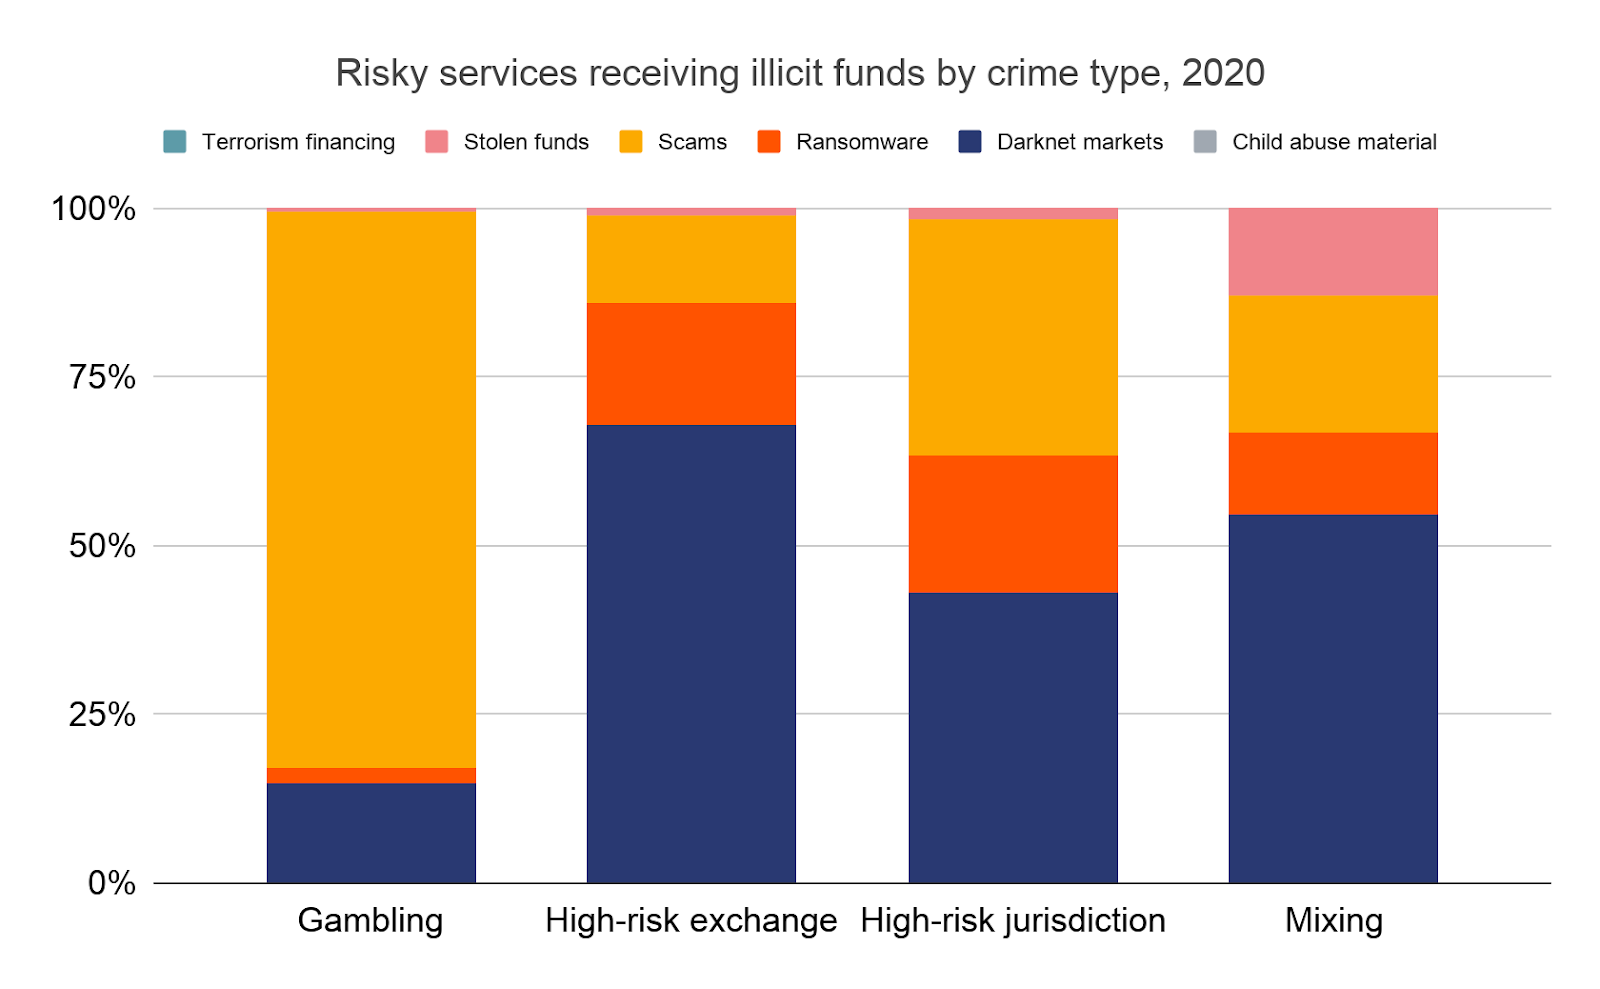
The most popular risky service categories for money laundering are similar for each crime category, with scams being the biggest exception. Scammers are much more likely than other cybercriminals to move funds to gambling platforms — a trend that began in 2020 and is best exemplified by the Mirror Trading International scam we cover elsewhere in this report — and to services headquartered in high-risk jurisdictions.
We can also see interesting trends when we look at money laundering through a geographic lens.
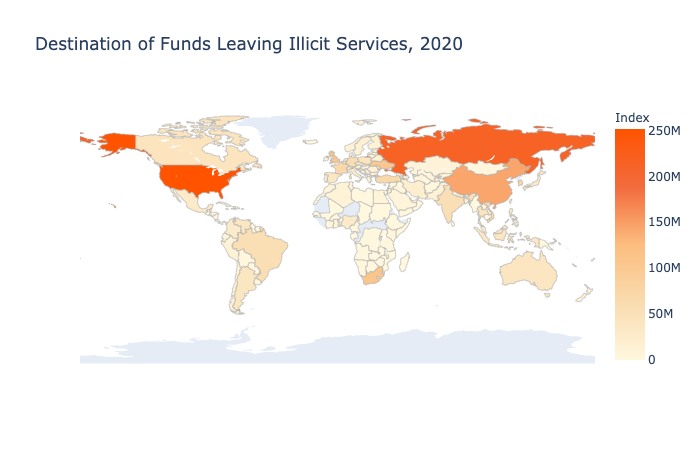
The following countries receive the highest volume of cryptocurrency from illicit addresses, based on the breakdowns of the locations of the users for the services receiving those funds:
- United States
- Russia
- China
- South Africa
- United Kingdom
- Ukraine
- South Korea
- Vietnam
- Turkey
- France
However, patterns emerge when we look at the geographic destination of funds by crime category:
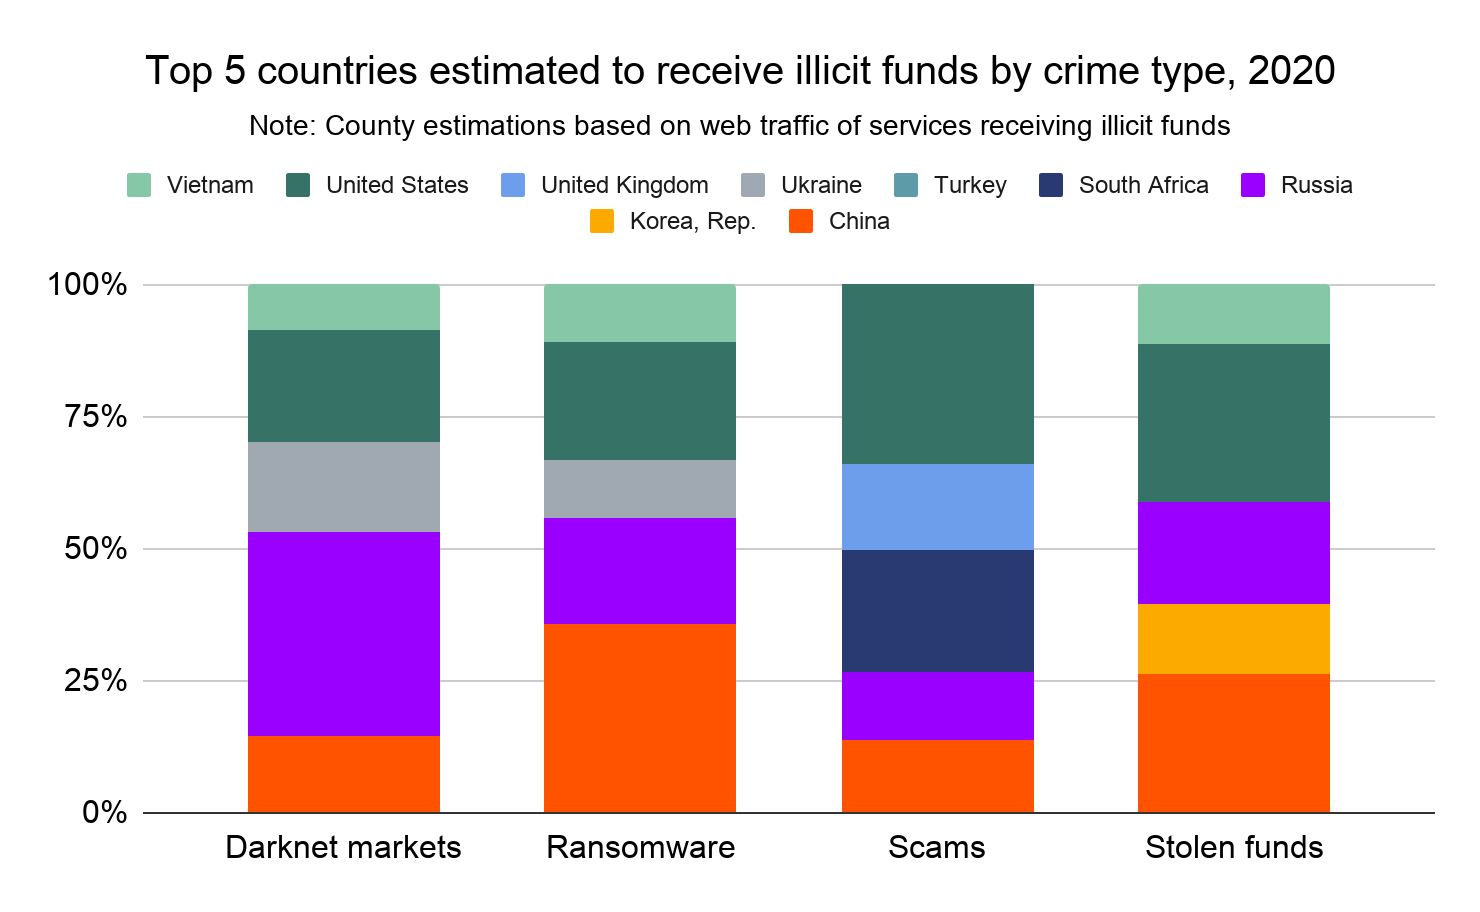
The first trend that stands out is Russia’s receipt of a disproportionately large share of darknet market funds, which is largely due to Hydra. Hydra is the world’s largest darknet market by revenue, and exclusively serves Russia and other Russian-speaking countries in Eastern Europe. China also stands out for receiving a disproportionate share of funds sent from addresses associated with stolen funds and ransomware. Some of this may come from cryptocurrency theft and ransomware activity associated with Lazarus Group, a cybercriminal syndicate linked to the North Korean government. A recent Department of Justice complaint identified two Chinese nationals who worked with Lazarus Group operatives to launder cryptocurrency that the group stole from exchanges. Other China-based cryptocurrency users could be engaged in similar activity. Finally, the United States is slightly overrepresented in funds received from addresses associated with scams and stolen funds.
Who are the money laundering service providers?
As we discuss above, most funds sent from illicit addresses make their way to deposit addresses at mainstream exchanges or at services we categorize as “risky,” including high-risk exchanges (e.g. exchanges with lax or nonexistent compliance programs), mixers, gambling platforms, or services headquartered in high-risk jurisdictions. Some of the deposit addresses receiving illicit funds are likely controlled by the cybercriminals sending the funds in the first place. But we know from our law enforcement partners and our own investigations that many of these deposit addresses belong to third-party services who, sometimes explicitly or implicitly, provide money laundering services to cybercriminals.
These third-party services largely fall into a broad category called “nested services.” Nested services operate within one or more larger exchanges, tapping into those exchanges’ liquidity and trading pairs. From a blockchain analysis standpoint, this means that by default, nested services’ transactions will show up as having been conducted on the underlying platform that hosts the nested service. Common examples of nested services include Over the Counter (OTC) brokers and instant exchangers. There’s a huge range in how much illicit transaction volume nested services process — some are just as compliant as mainstream exchanges, while others appear to cater specifically to cybercriminals. Many appear to be large businesses for whom illicit activity is just a small share of total transaction volume, suggesting that these services are likely inadvertently moving illicit funds due to lax compliance policies, but could continue to operate if they stopped. However, some of these deposit addresses receive such a high percentage of their funds from illicit addresses that it seems impossible the activity could be inadvertent, or that the service could even continue to operate without serving cybercriminals.
Below, we’ll share what we know about the deposit addresses facilitating money laundering, starting with the services hosting them.
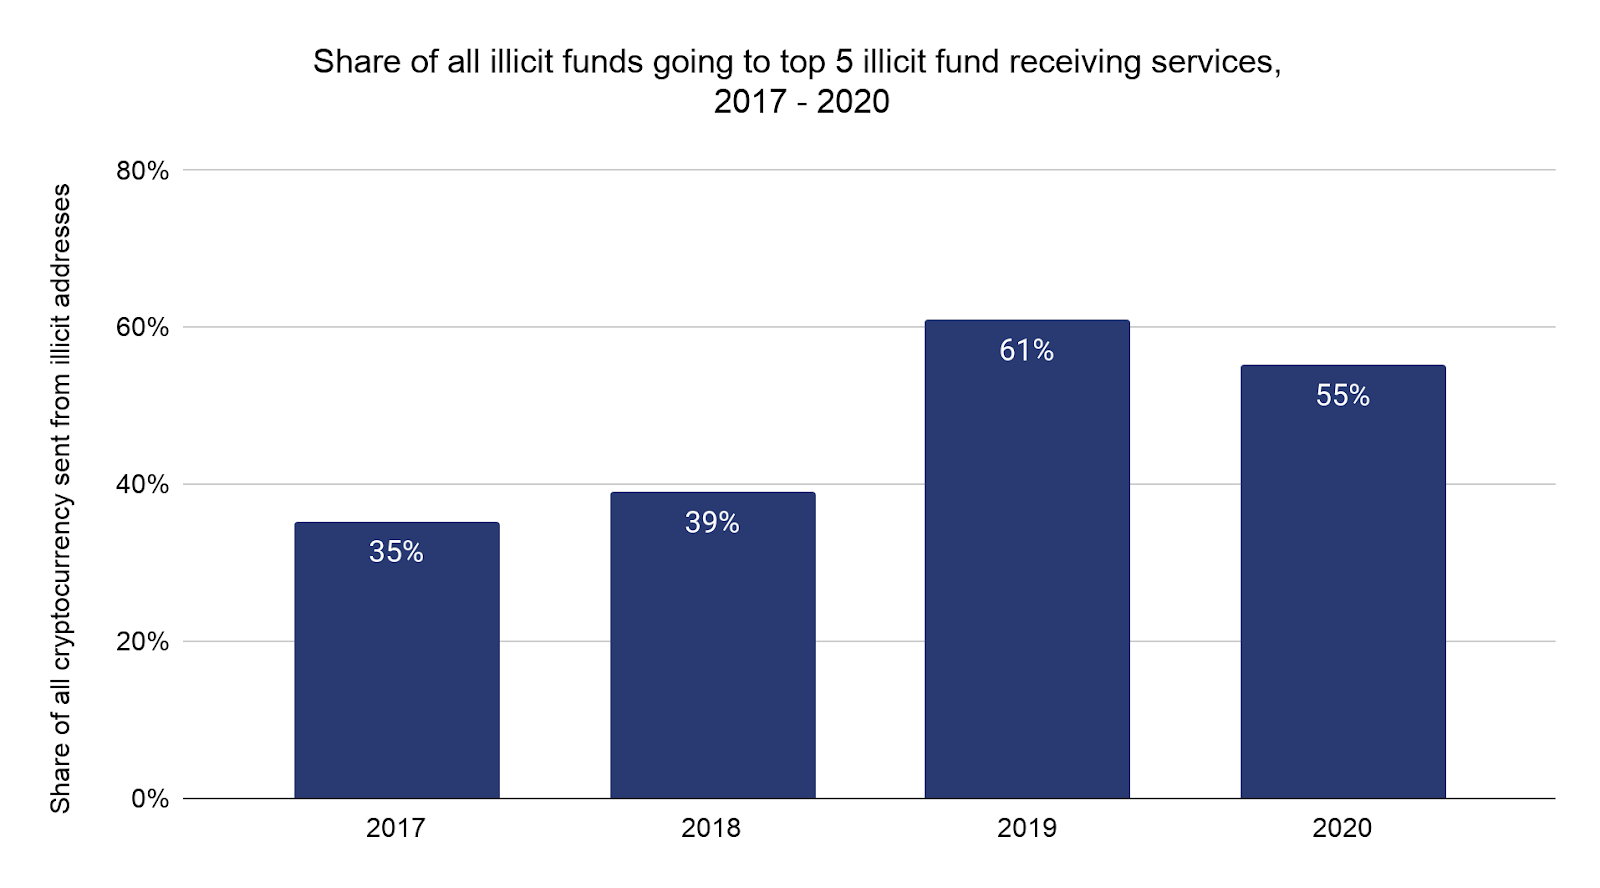
Cryptocurrency sent from illicit addresses tends to wind up at just a few services. Below, we show the share of all illicit funds going to the five services receiving the most illicit funds each year since 2017, both overall and broken down by crime type. The top two services receiving illicit funds have remained constant over the three years we studied, with some change in the third, fourth, and fifth spots. Together, the top two take in more than the other three do combined in any given year. Overall in 2020, these top five services received 55% of all funds moved from illicit addresses.
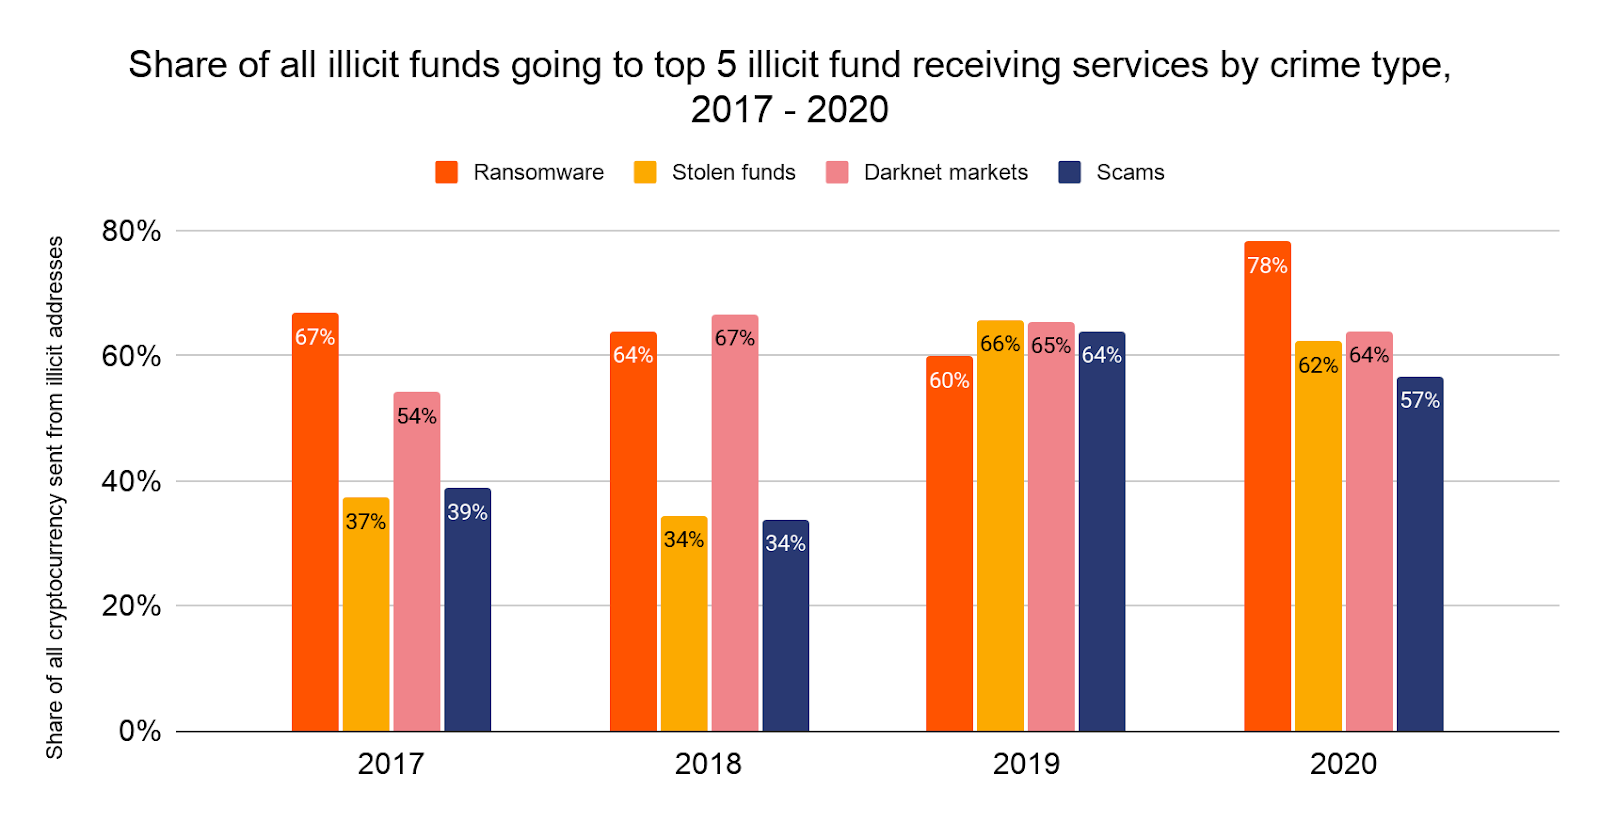
Notably, addresses associated with ransomware have the highest share of sending activity concentrated to the top five services, at 78% in 2020.
But what happens if we go one level deeper from the services and look at the individual deposit addresses? In the graph below, we look at all deposit addresses that received any illicit funds in 2020, broken down by the range of illicit funds received.
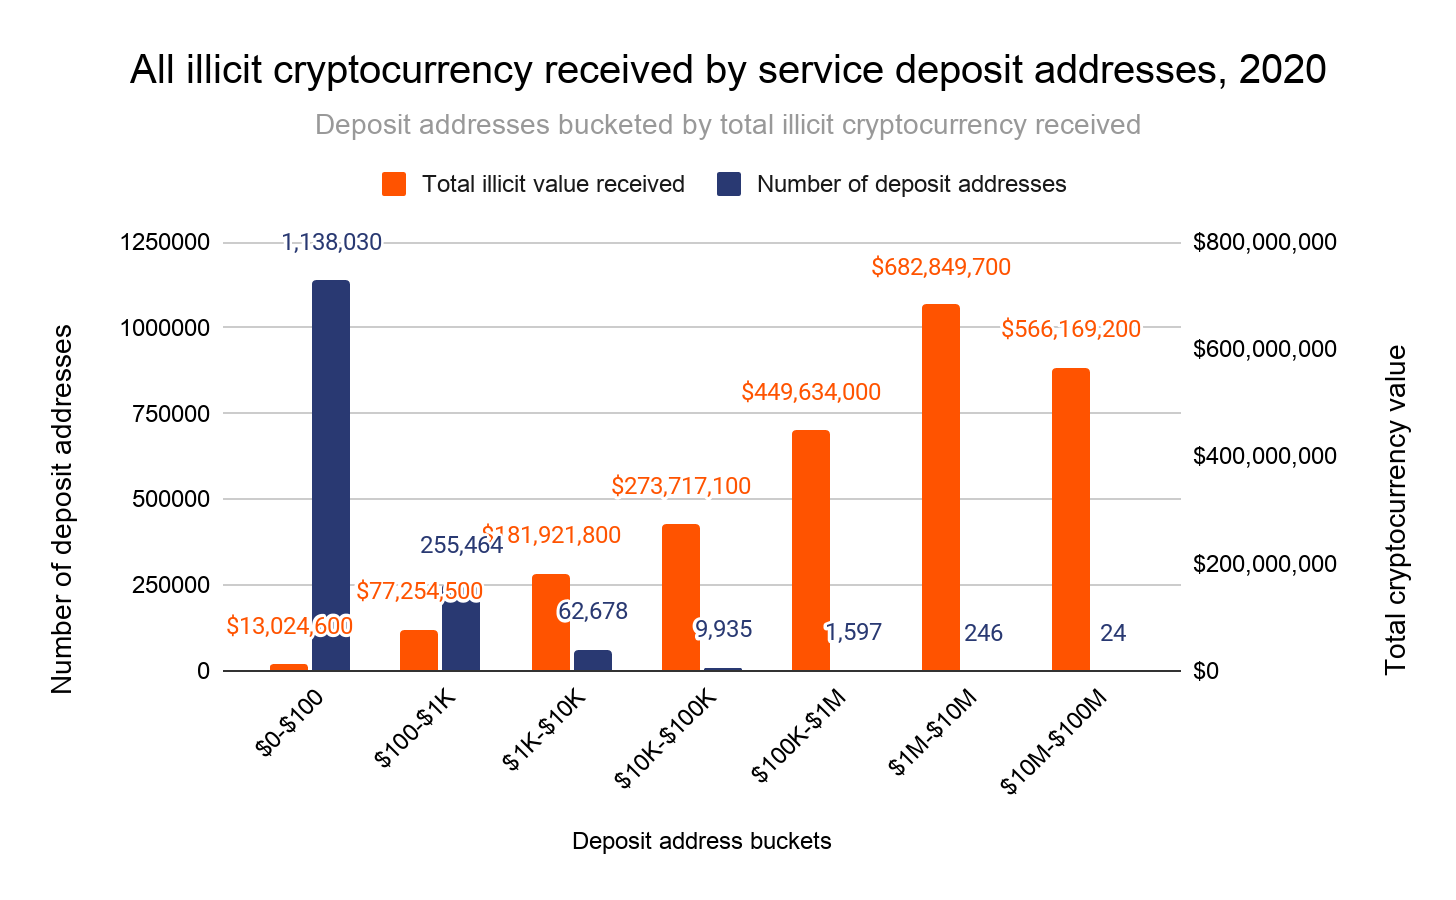
How to read this graph: This graph shows service deposit addresses bucketed by how much total illicit cryptocurrency value each address received individually in 2020. Each blue bar represents the number of deposit addresses in the bucket, while each orange bar represents the total illicit cryptocurrency value received by all deposit addresses in the bucket. Using the first bucket as an example, we see that 1,138,030 deposit addresses received between $0 and $100 worth of illicit cryptocurrency, and together all of those deposit addresses received a total of $13 million worth of illicit cryptocurrency.
Money laundering activity is even more concentrated at the deposit address level. In fact, the data above shows that a group of just 1,867 deposit addresses received 75% of all cryptocurrency value sent from illicit addresses in 2020. A smaller group of 270 deposit addresses received 55%. Thinking in terms of raw value rather than percentages, those 270 addresses collectively received $1.3 billion worth of illicit cryptocurrency in 2020, and a smaller group of just 24 received over $500 million worth of illicit cryptocurrency in 2020.
This level of concentration is greater than in 2019. Below, we look at how the shares of all illicit cryptocurrency received by deposit addresses in each of the buckets shown above changed from 2019 to 2020.
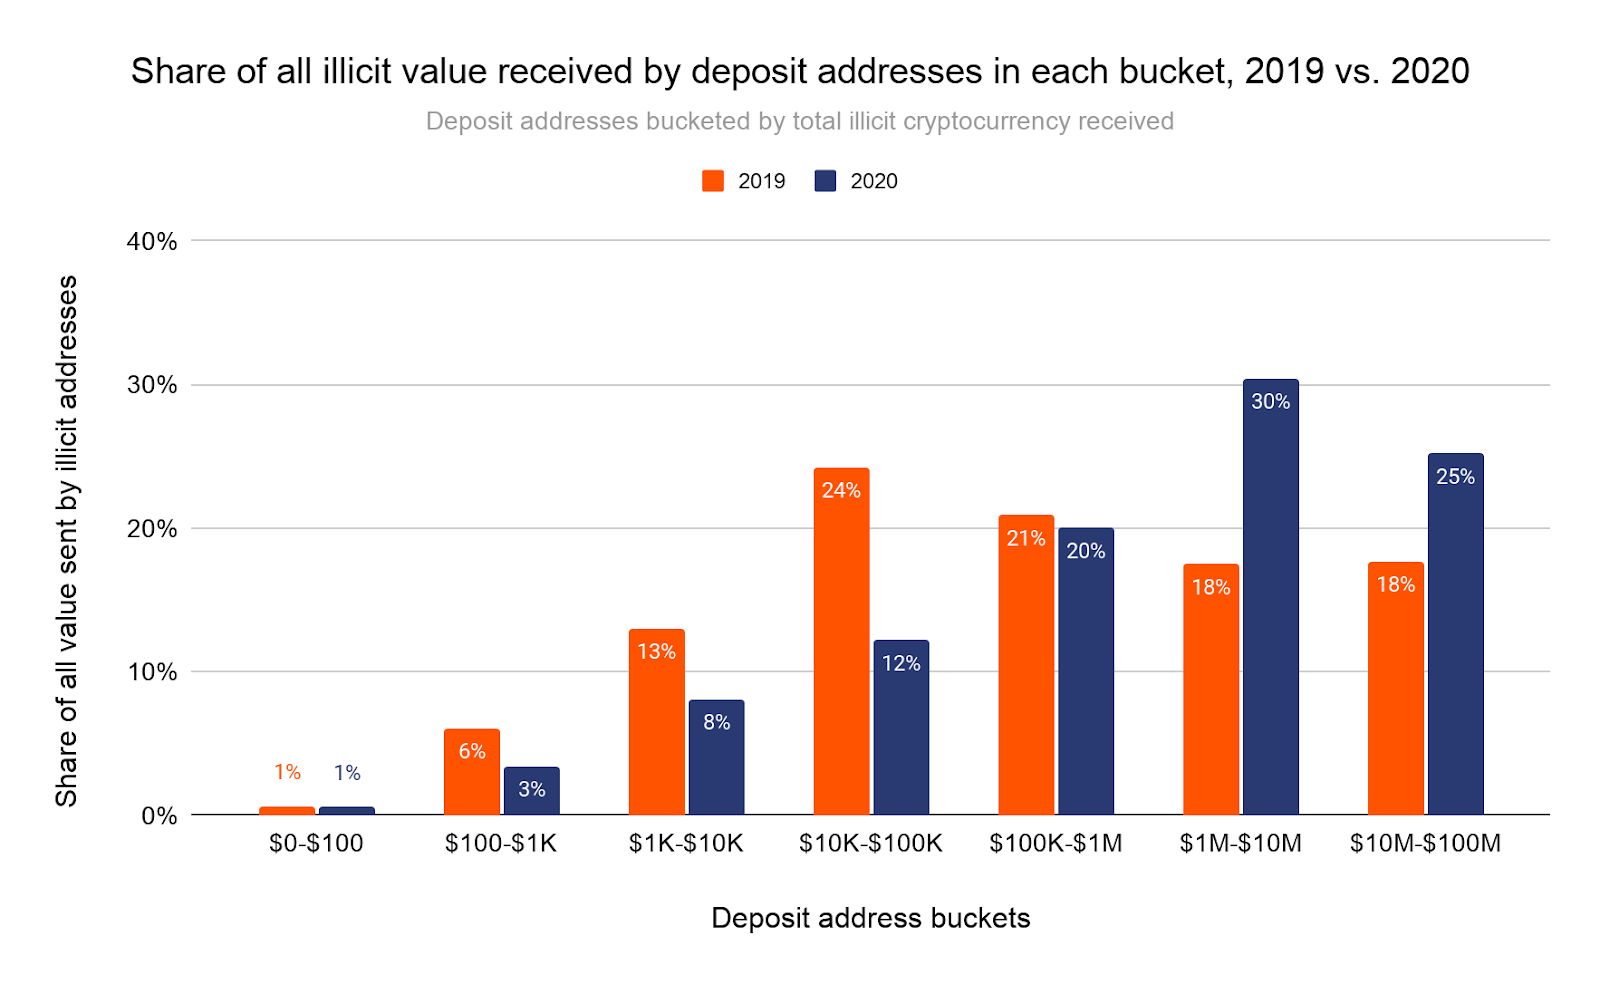
In particular, we see a much greater share of illicit cryptocurrency going to addresses taking in between $1 million and $100 million worth of cryptocurrency per year.
We believe the growing concentration of deposit addresses receiving illicit cryptocurrency reflects cybercriminals’ increasing reliance on a small group of OTC brokers and other nested services specializing in money laundering. In order to investigate further, we decided to look more closely at the 270 deposit addresses that received more than $1 million worth of cryptocurrency from illicit addresses in 2020. In the scatter chart below, we plot those addresses based on the total amount they’ve received from illicit addresses,versus the share those illicit funds make up of the addresses’ total amount received.
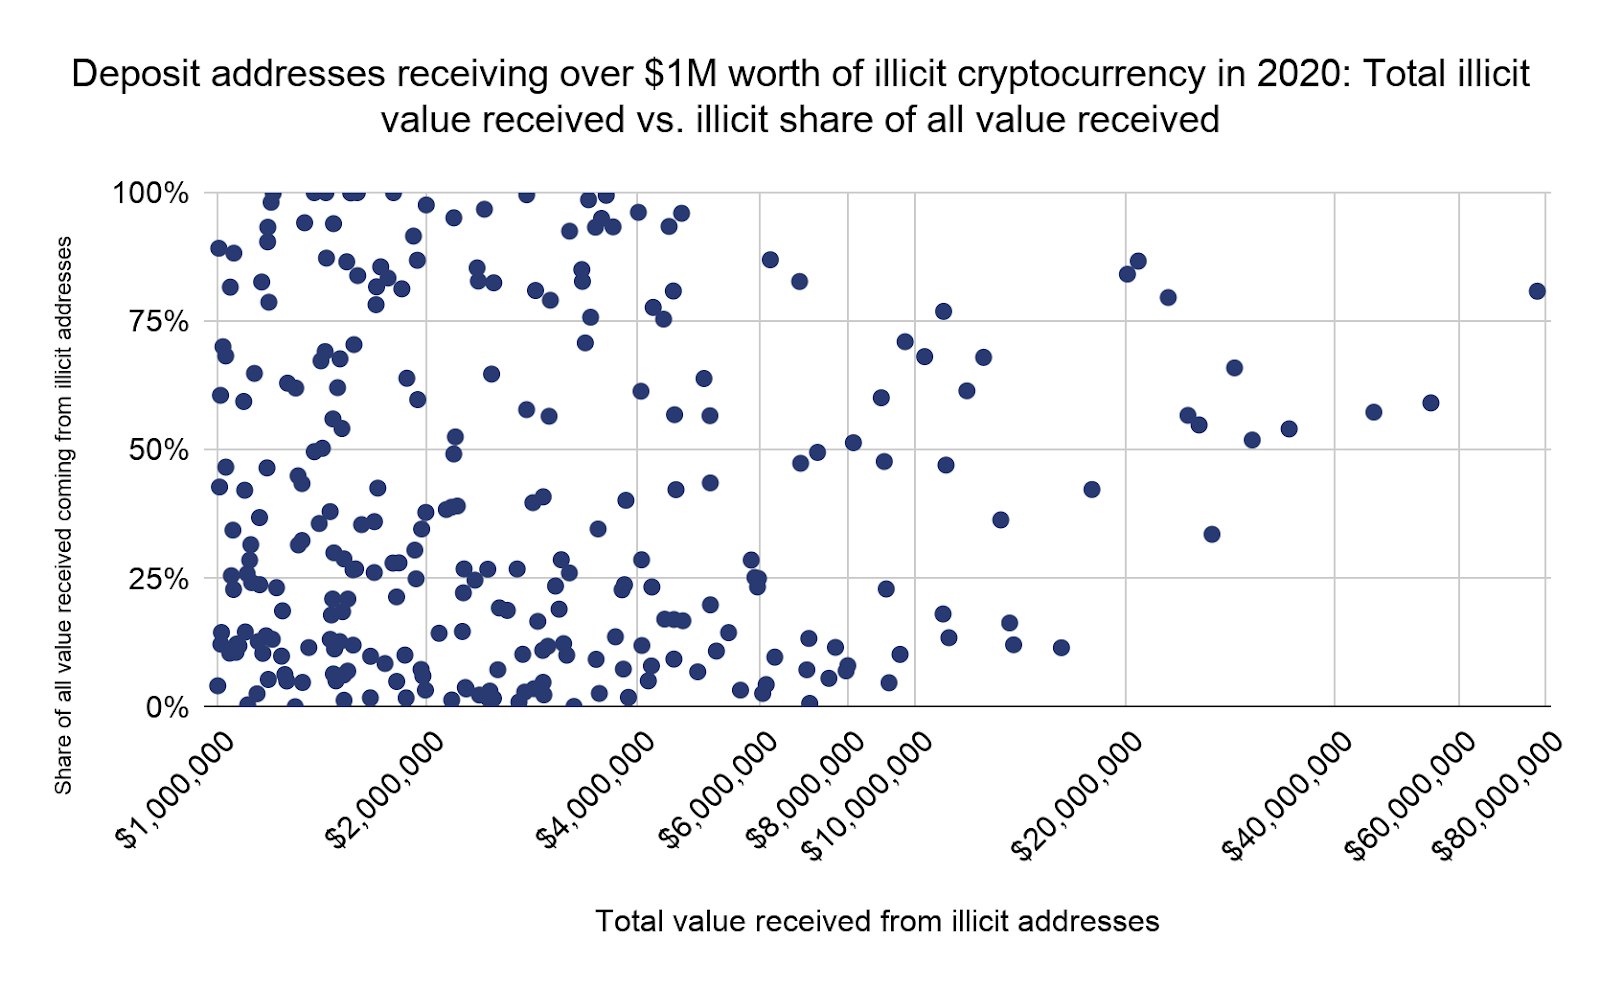
An interesting trend emerges when we look at the deposit addresses that facilitate the most money laundering shown above. Though they individually and collectively may facilitate a great deal of money laundering, legitimate activity also makes up a significant share of total transaction volume for many of these deposit addresses, especially those that received less than $25 million in cryptocurrency from illicit addresses. In fact, illicit addresses account for under 10% of total cryptocurrency received for many of these addresses, even moreso below the $10 million mark. This suggests that the money laundering those addresses facilitate could simply be inadvertent and due to shortcomings in the compliance programs of the nested services controlling them.
However, we see no such evidence for any of the deposit addresses receiving over $25 million worth of cryptocurrency from illicit addresses. All of those deposit addresses receive at least 34% of their total funds from illicit sources, with that figure rising above 50% for most of them. It would be difficult to believe that these services are receiving such a high percentage of funds from illicit addresses by accident — those of them that are nested services could likely not survive as businesses without those funds — so we characterize those addresses as primarily serving cybercriminals.
Below, we expand our set of deposit addresses to include all that received any funds from illicit addresses in 2020, and break them down by the share of all funds they receive that comes from illicit addresses. We see that the wallets receiving the most illicit funds overall are those for whom illicit funds make up the biggest percentage of all funds received., In other words, the small group of actors laundering the most money seem to specialize in it.
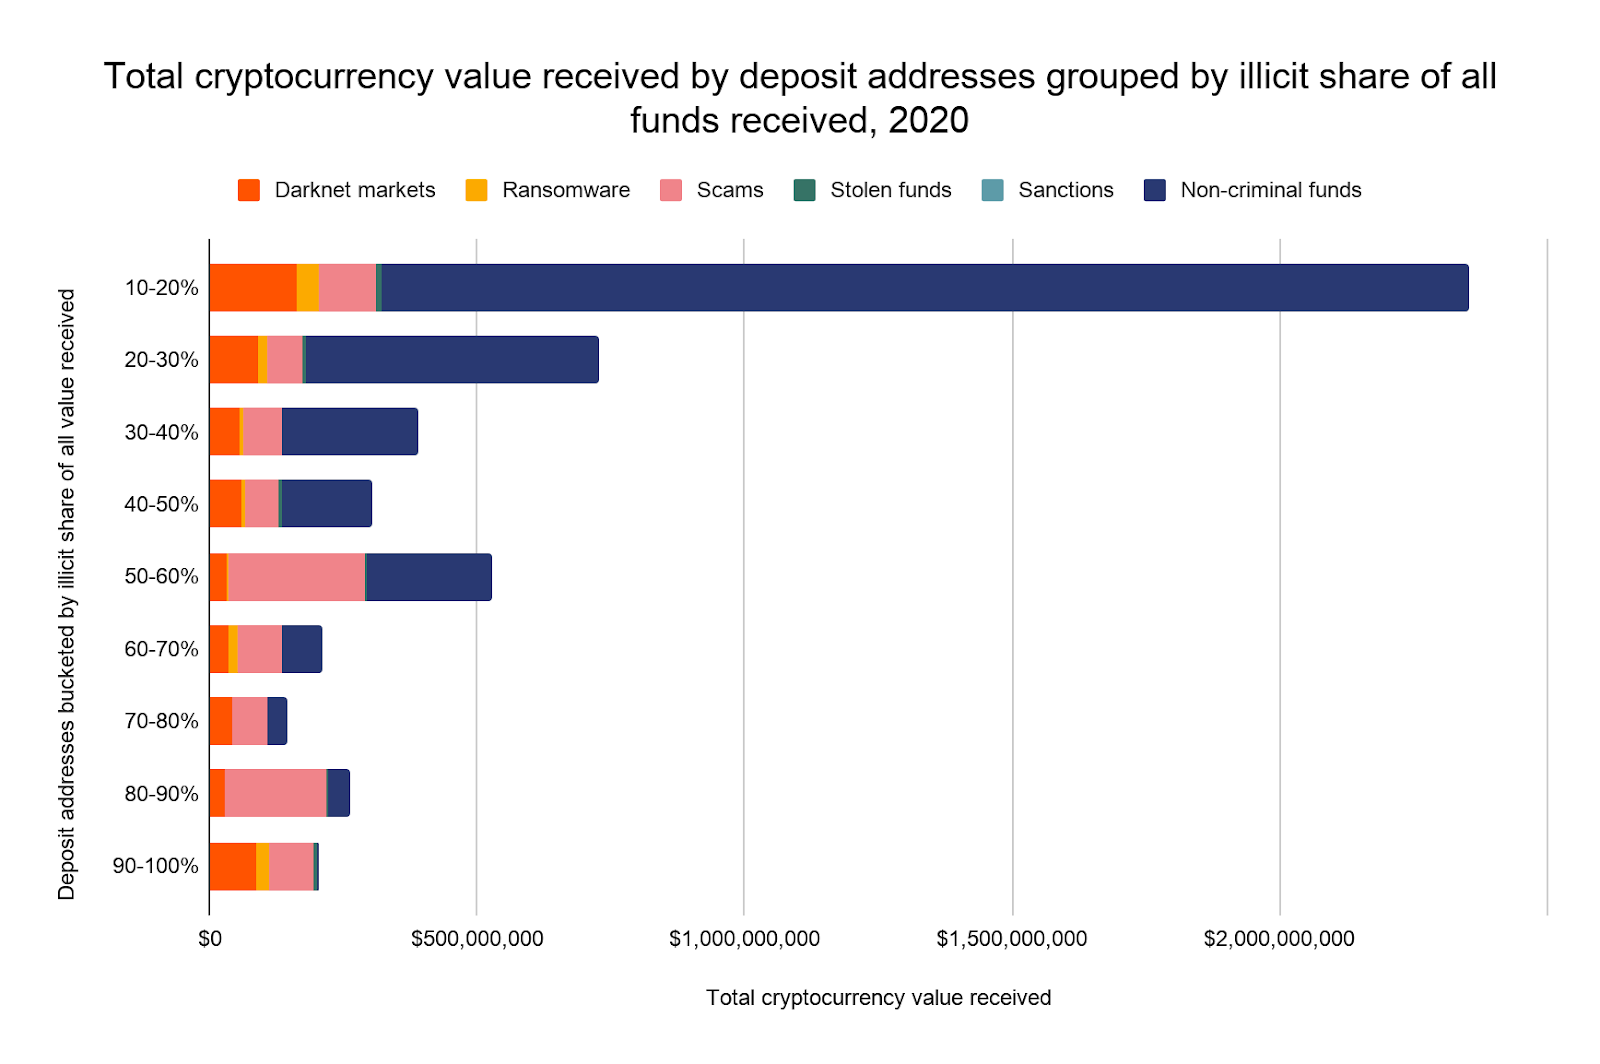
55% of all illicit funds moving to services end up at deposit addresses for which illicit addresses supply 50% or more of all funds. That figure rises to 71% for deposit addresses with 30% or more of all funds received coming from illicit addresses. In other words, a significant share of money laundering in cryptocurrency isn’t flying under the radar at big services who can’t sift through transactions to spot it, but is being actively facilitated by nested services for whom money laundering is a key part of the business model. Law enforcement could significantly hamper cybercriminals’ ability to convert cryptocurrency into cash by identifying and prosecuting the owners of these deposit addresses. In addition, this shows that the services hosting these deposit addresses, most of which belong to nested services, need to be more diligent in their transaction monitoring. They too could make the cryptocurrency ecosystem safer by cracking down on the worst offenders.
We should also note that even the non-illicit share of funds received for some of these addresses should be treated with suspicion, as they could represent money laundering associated with offline criminal activity — in other words, bad actors criminally-obtained exchanging fiat money for cryptocurrency in an effort to hide it. We’ll explore this element of cryptocurrency money laundering in our case studies at the end of this section.
Overall, what the data makes clear is that most illicit funds travel to service deposit addresses for whom money laundering makes up a huge portion of their activity, to the point that many of them appear to have no other purpose. A smaller but still significant portion also goes to deposit addresses doing a high volume of legitimate transactions, which could allow the illicit activity to fly under the radar, reinforcing the need for compliance professionals and investigators to stringently assess all deposit addresses — especially those of nested services.
This blog is an excerpt from the Chainalysis 2021 Crypto Crime Report. Click here to download the whole thing!
