This blog is a preview of our 2021 Geography of Cryptocurrency report. Sign up here to download the whole thing!
DeFi’s growth has been one of the biggest stories in cryptocurrency over the last 18 months. DeFi stands for “decentralized finance,” and refers to a class of decentralized cryptocurrency platforms that can run autonomously without the support of a central company, group, or person. How is this possible? DeFi platforms, also known as protocols, are built on top of smart contract-enriched blockchains — primarily the Ethereum network — and can fulfill specific financial functions determined by the smart contracts’ underlying code. Popular types of DeFi protocols include decentralized exchanges and lending platforms.
While concerns remain around DeFi’s safety and compliance obligations, it represents one of the fastest-growing and most innovative sectors of the cryptocurrency economy. That’s why this year, we decided to create a new geographic index ranking countries by DeFi adoption specifically. Similar to our Crypto Adoption Index, the DeFi Adoption Index is designed to highlight countries with the highest grassroots adoption by individuals, rather than those sending the largest raw values of funds. The data suggests that while grassroots cryptocurrency adoption generally is highest in emerging markets, DeFi adoption is strongest in high-income countries that already had substantial cryptocurrency usage, especially amongst traders and institutional investors. We break down both those findings and the DeFi Adoption Index’s methodology below.
Our methodology
The DeFi Adoption Index is made up of three component metrics, which we’ll explain in more detail below. We rank all 154 countries according to each of those three metrics, take the geometric mean of each country’s ranking in all three, and then normalize that final number on a scale of 0 to 1 to give every country a score that determines the overall rankings. The closer the country’s final score is to 1, the higher the rank.
Component 1: On-chain cryptocurrency value received by DeFi platforms weighted by PPP per capita
The goal of this metric is to rank each country by total DeFi activity, but weight the rankings to favor countries where that amount is more significant based on the wealth of the average person and value of money generally within the country. We calculate the metric by estimating total cryptocurrency received by DeFi protocols from users in a given country, and weighting the on-chain value based on PPP per capita, which is a measure of the country’s wealth per resident. The higher the ratio of on-chain value received to PPP per capita, the higher the ranking, meaning that if two countries sent equal amounts to DeFi protocols, the country with the lower PPP per capita would rank ahead.
Component 2: Total retail value received by DeFi platforms
The goal of this metric is to measure the DeFi activity of non-professional, individual cryptocurrency users, based on how much cryptocurrency they’ve sent to DeFi protocols in retail-sized transactions, meaning under $10,000 USD, compared to the wealth of the average person. We then rank each country according to this metric but weight it to favor countries with a lower PPP per capita.
Component 3: Individual deposits to DeFi platforms
The goal of this metric is to rank countries based on whose residents are carrying out the highest number of DeFi transactions. We measure this by taking the ratio of DeFi transactions to the country’s total number of internet users. The higher the ratio, the higher the ranking, meaning that if two countries had an equal number of deposits, the country with fewer internet users would rank higher.
This year, we removed the individual deposits metric from our overall cryptocurrency adoption index because it artificially favors DeFi transactions over those carried out on centralized exchanges, since DeFi protocols’ non-custodial nature means all DeFi transactions are captured on-chain, whereas trades within a centralized exchange are only captured on exchange order books. However, that’s not a concern in this case where we’re only measuring DeFi transactions, which means we can measure individual transactions to get an idea of the number of users interacting with DeFi protocols.
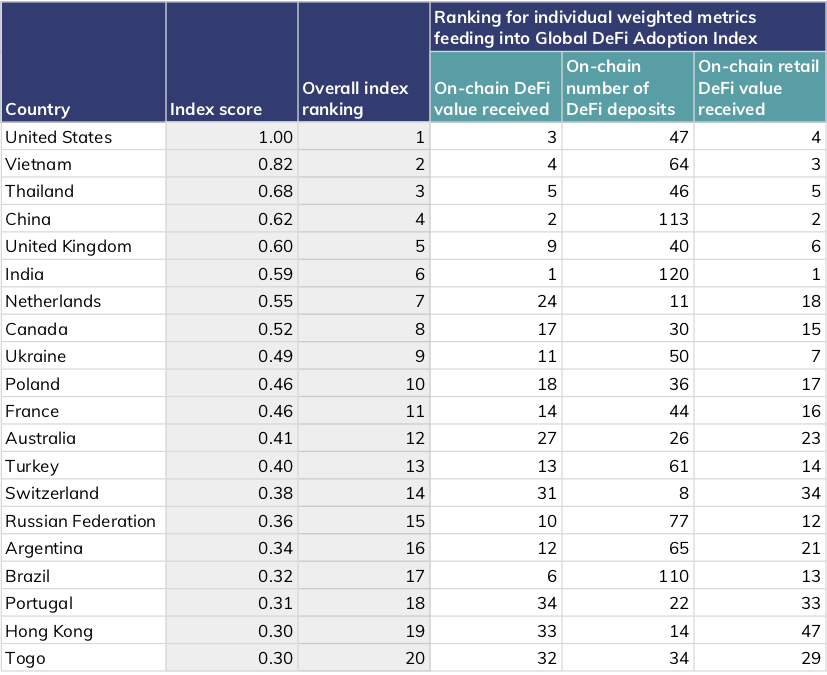
The 2021 Global DeFi Adoption Index Top 20
What stands out here is that unlike with our Crypto Adoption Index, many of the countries ranking highest in grassroots DeFi adoption are those with high raw volumes of cryptocurrency value moved, both currently and historically. These tend to be middle to high-income countries or countries with already-developed cryptocurrency markets, and in particular strong professional and institutional markets. Standout countries exemplifying these trends are the United States, China, Vietnam, the UK, and several other Western European countries that rank high on the DeFi Adoption Index.
Historic web traffic data for DeFi protocols shows us how DeFi adoption has unfolded over time at the regional level.
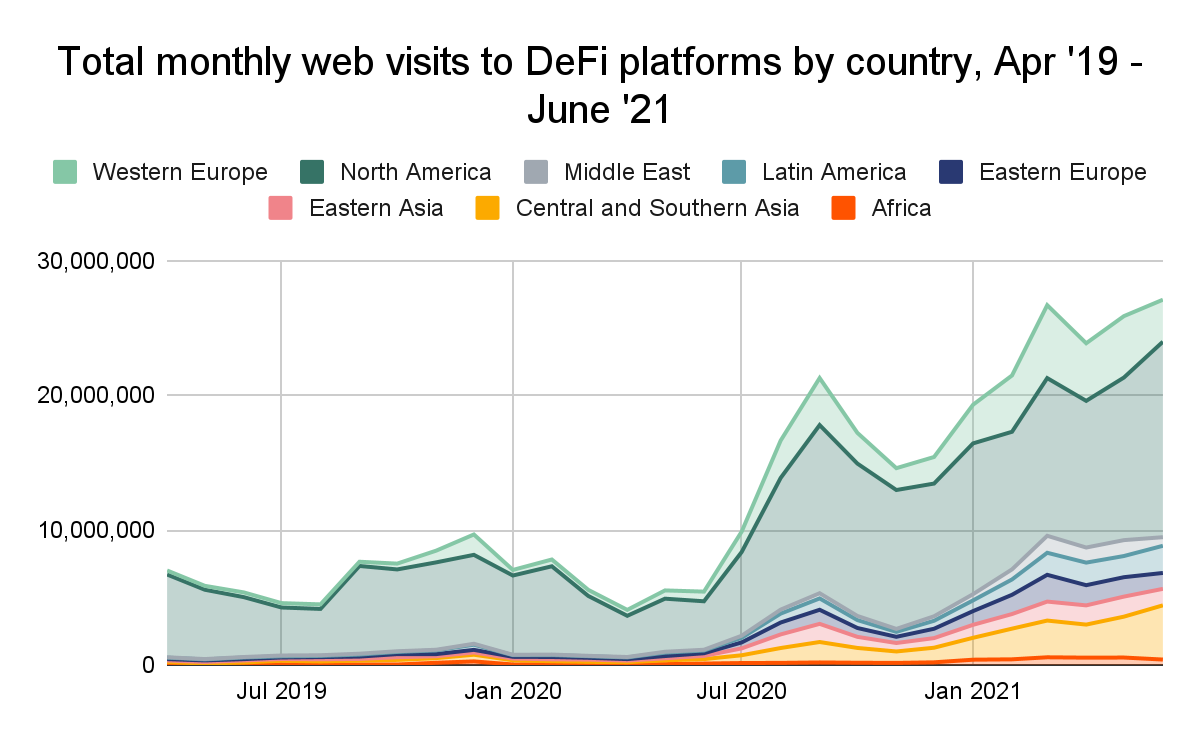
From April 2019 until roughly June 2020, the vast majority of web traffic to DeFi protocols came from North America, with Western Europe adding a substantial and growing percentage starting around September 2019. Around June 2020, we see more and more traffic from other regions, especially Central and Southern Asia, as total value sent to DeFi platforms begins to explode. Though China has become one of the biggest single countries for DeFi transaction volume, East Asia’s regional share of DeFi protocol web traffic remains low in comparison to its share of traffic to centralized cryptocurrency services.
The breakdown of the share of transaction volume by transaction size for DeFi protocols compared to all cryptocurrency activity reinforces our understanding of who’s using DeFi.
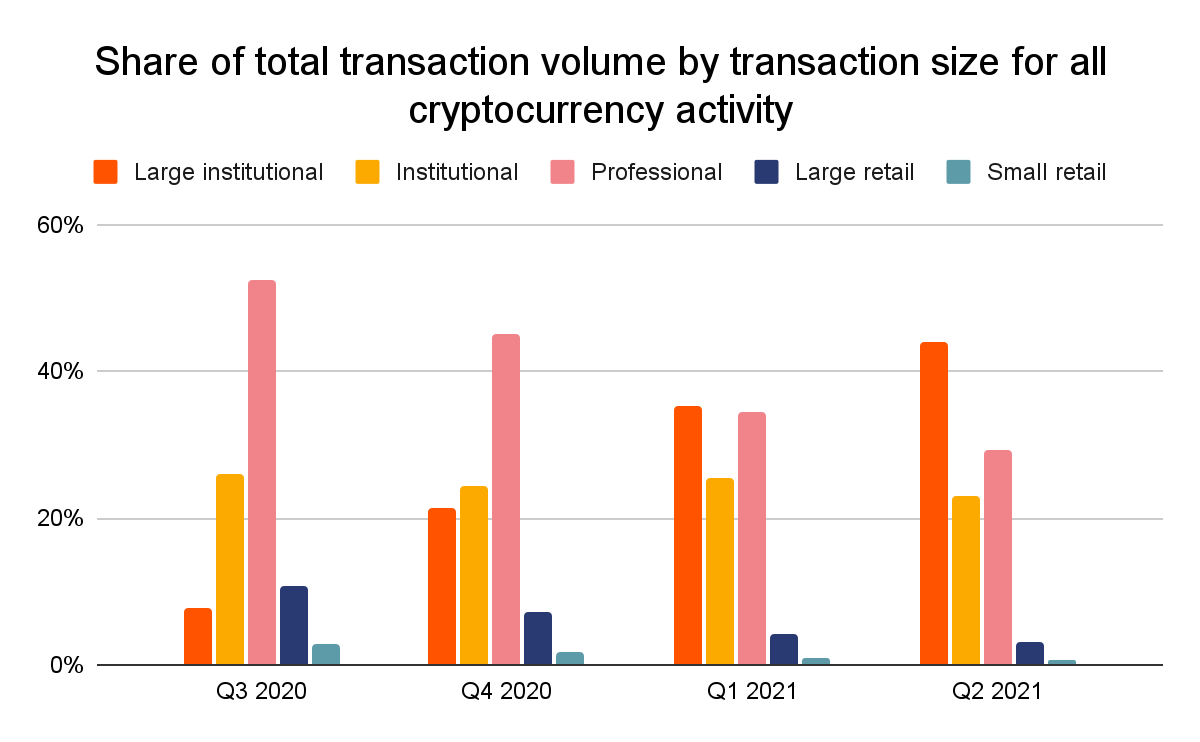
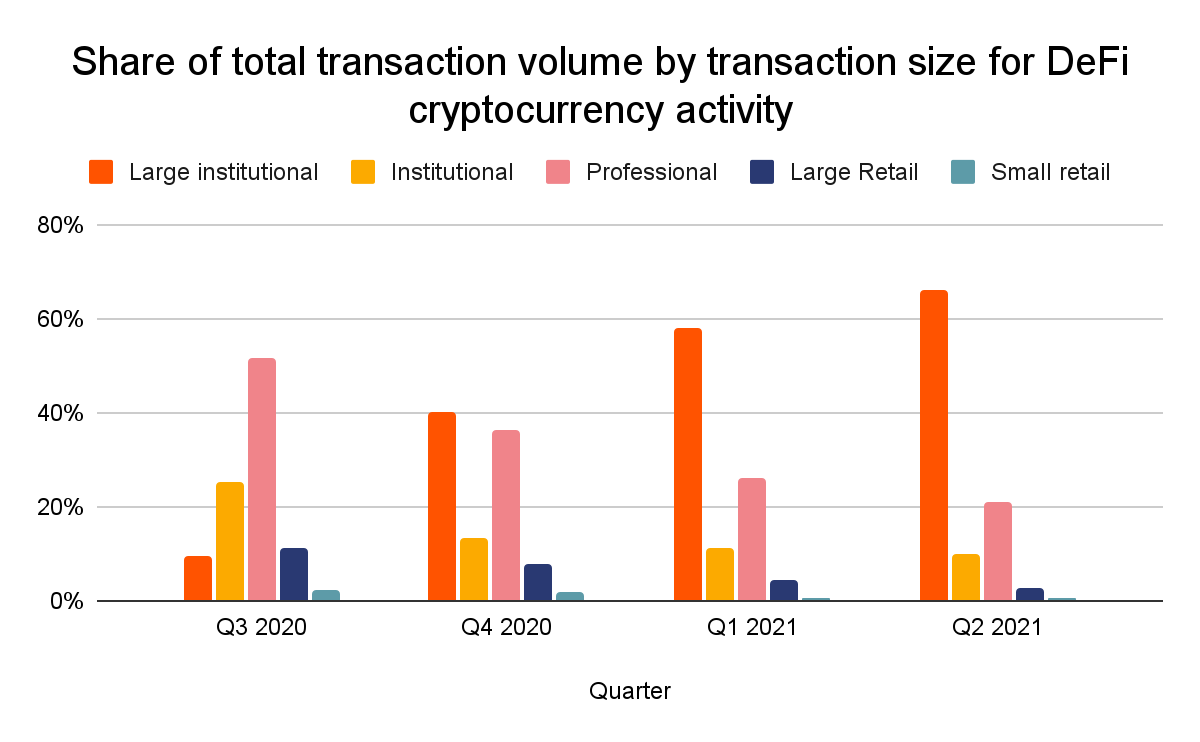
The data shows that large transactions make up a much bigger share of DeFi activity, suggesting that DeFi is disproportionately popular for bigger investors compared to cryptocurrency as a whole. Large institutional transactions, meaning those above $10 million in USD, accounted for over 60% of DeFi transactions in Q2 2021, compared to under 50% for all cryptocurrency transactions. Professional, large retail, and small retail-sized transactions also accounted for a bigger percentage of all cryptocurrency activity compared to DeFi activity in that same time period.
We can also see that countries with the historically largest institutional and professional markets are driving the most DeFi activity. Below, we break all countries ranked in our index down into five buckets based on the size of their professional and institutional markets, and show their transaction volume for both cryptocurrency in general and DeFi specifically.
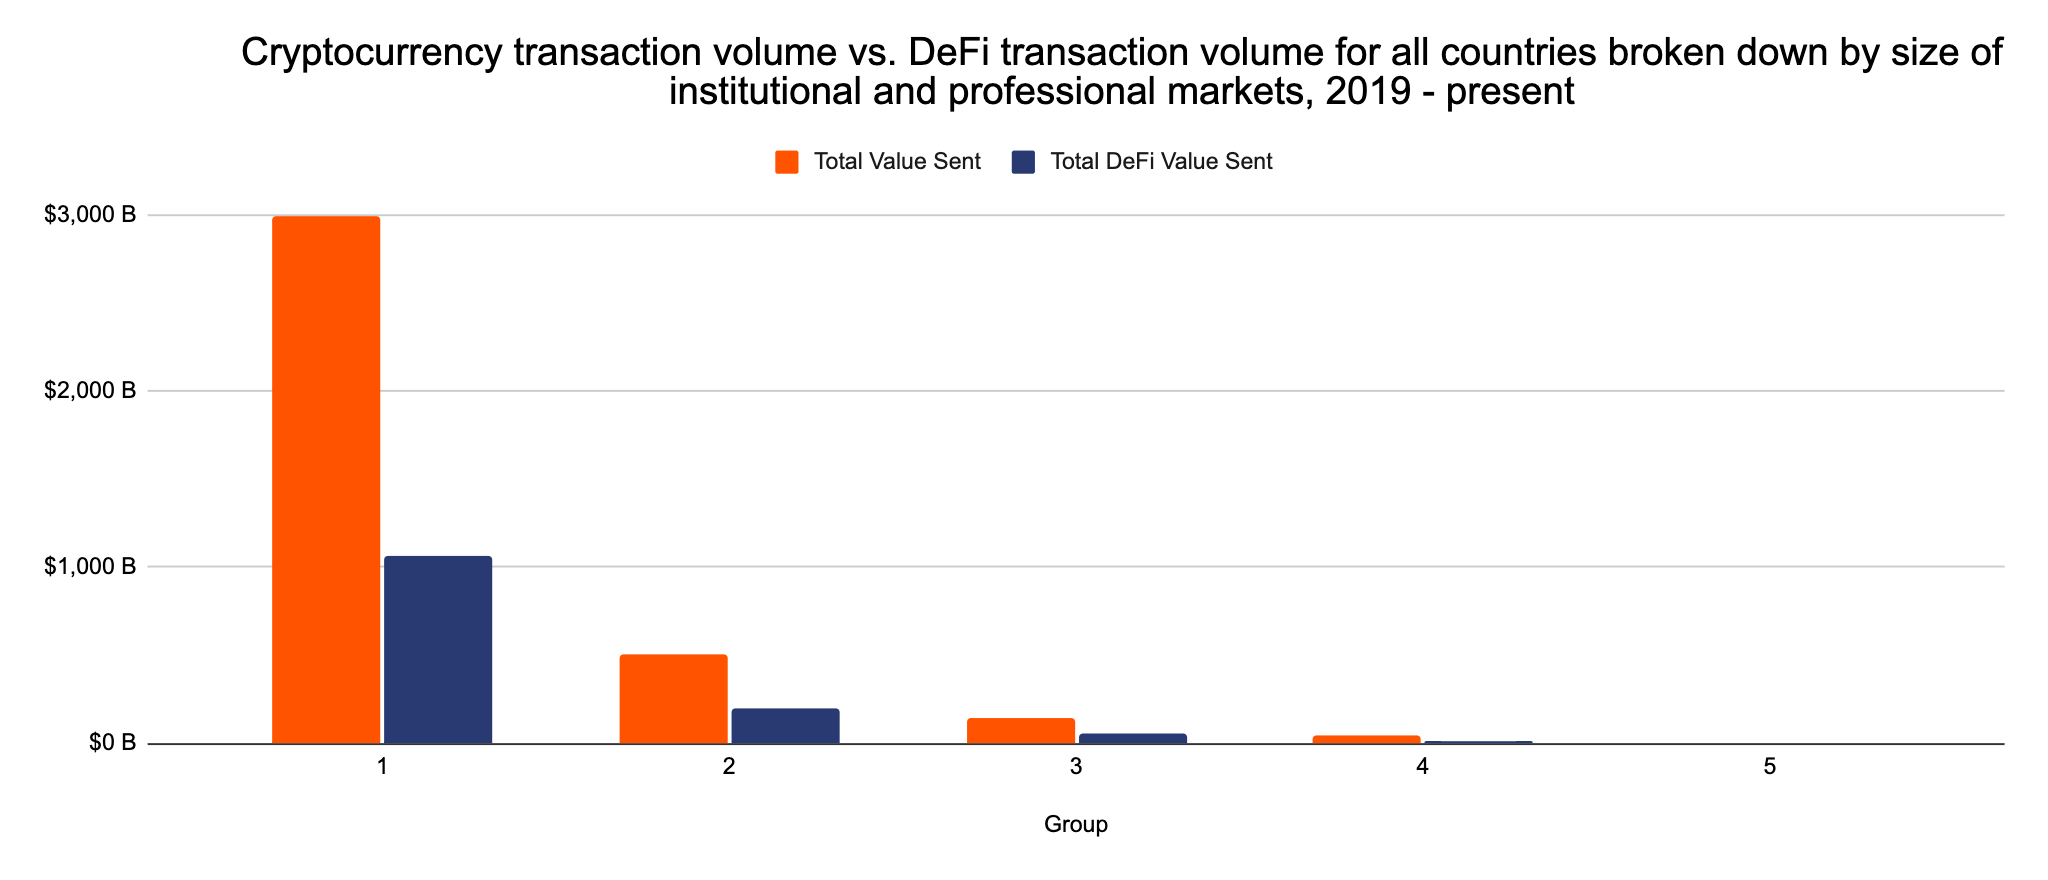
As we can see, countries that have historically accounted for the most professional and institutional-sized cryptocurrency transactions are also driving the most DeFi activity.
With these numbers in mind, we spoke to David Gogel, Growth Lead at dydx, a popular DeFi protocol focused on cryptocurrency derivatives, to learn more about DeFi’s regional growth patterns. He explained that large-scale traders, from individuals operating at a professional level to cryptocurrency hedge funds, have been the biggest adopters of DeFi so far. “Right now, DeFi is targeted towards crypto insiders,” he said. “It’s people who have been in the industry for a while and have enough funds to experiment with new assets. In the long run as ETH gas prices fall, it’ll become accessible to more people.” Gogel cited the United States, China, Russia, and several Western European countries with high cryptocurrency adoption as some of the key growth markets for DeFi.
A tale of two ecosystems
Our adoption data combined with David Gogel’s description of DeFi’s growth markets illuminates the distinctions between the DeFi ecosystem and the larger cryptocurrency ecosystem. At the grassroots level, emerging markets are driving cryptocurrency adoption, with users in these areas turning to the asset class out of necessity, either to preserve their savings in the face of currency devaluation or to carry out remittances they wouldn’t otherwise be able to. DeFi adoption, on the other hand, has primarily been powered by experienced cryptocurrency traders and investors looking for new sources of alpha in innovative new platforms, even when we weight our index to favor grassroots adoption. At the geographic level, that’s why we see more adoption in high-income countries with established cryptocurrency user bases. The question for the coming years is whether we’ll see DeFi follow the same pattern as the cryptocurrency services that came before it, with wider swaths of the population adopting it for tangible benefits beyond speculation and investment.
This blog is a preview of our 2021 Geography of Cryptocurrency report. Sign up here to download the whole thing!
